|
Download Data (XLS File) |
|
||||||||
|
||||||||
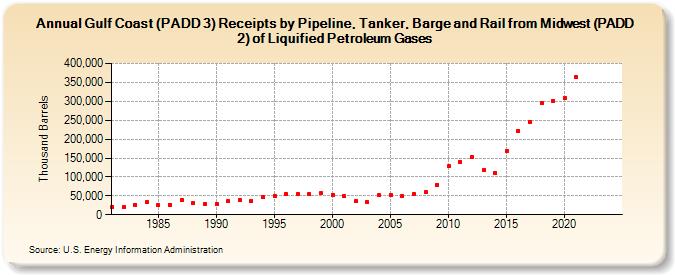
| Gulf Coast (PADD 3) Receipts by Pipeline, Tanker, Barge and Rail from Midwest (PADD 2) of Liquified Petroleum Gases (Thousand Barrels) | ||||||||
| Decade | Year-0 | Year-1 | Year-2 | Year-3 | Year-4 | Year-5 | Year-6 | Year-7 | Year-8 | Year-9 |
|---|---|---|---|---|---|---|---|---|---|---|
| 1980's | 21,313 | 20,292 | 26,375 | 32,538 | 24,967 | 26,937 | 40,089 | 30,180 | 29,061 | |
| 1990's | 28,233 | 35,446 | 40,203 | 36,001 | 45,655 | 49,761 | 54,213 | 54,125 | 53,579 | 56,247 |
| 2000's | 53,105 | 48,313 | 36,596 | 33,405 | 51,064 | 53,162 | 48,906 | 54,423 | 59,938 | 79,443 |
| 2010's | 127,659 | 138,899 | 151,336 | 118,457 | 110,962 | 168,811 | 222,657 | 246,526 | 296,676 | 301,314 |
| 2020's | 309,593 | 363,073 | -- | -- |
| - = No Data Reported; -- = Not Applicable; NA = Not Available; W = Withheld to avoid disclosure of individual company data. |
| Release Date: 3/29/2024 |
| Next Release Date: 8/30/2024 |