|
Download Data (XLS File) |
|
||||||||
|
||||||||
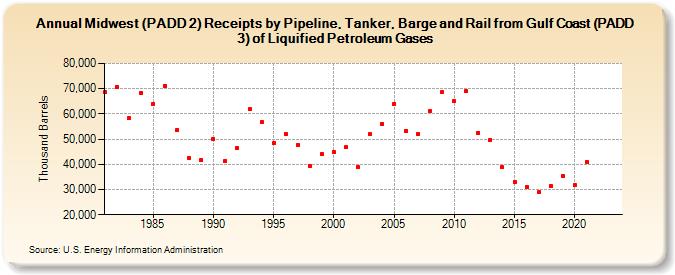
| Midwest (PADD 2) Receipts by Pipeline, Tanker, Barge and Rail from Gulf Coast (PADD 3) of Liquified Petroleum Gases (Thousand Barrels) | ||||||||
| Decade | Year-0 | Year-1 | Year-2 | Year-3 | Year-4 | Year-5 | Year-6 | Year-7 | Year-8 | Year-9 |
|---|---|---|---|---|---|---|---|---|---|---|
| 1980's | 68,596 | 70,731 | 58,301 | 68,453 | 64,090 | 71,035 | 53,596 | 42,335 | 41,690 | |
| 1990's | 50,060 | 41,218 | 46,416 | 61,757 | 56,877 | 48,320 | 52,086 | 47,785 | 39,438 | 44,162 |
| 2000's | 44,736 | 46,719 | 38,914 | 51,896 | 56,181 | 63,952 | 53,402 | 52,090 | 61,021 | 68,511 |
| 2010's | 64,920 | 69,003 | 52,449 | 49,723 | 38,737 | 32,909 | 31,000 | 28,873 | 31,417 | 35,553 |
| 2020's | 31,840 | 40,724 | -- | -- |
| - = No Data Reported; -- = Not Applicable; NA = Not Available; W = Withheld to avoid disclosure of individual company data. |
| Release Date: 3/29/2024 |
| Next Release Date: 8/30/2024 |