|
Download Data (XLS File) |
|
||||||||
|
||||||||
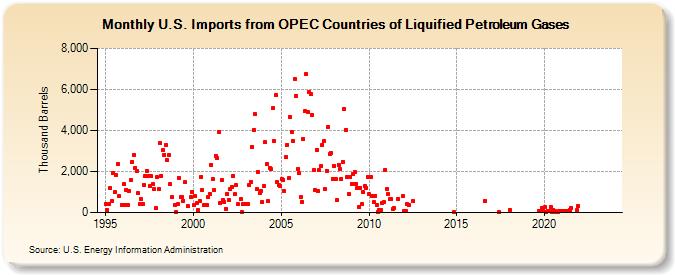
| U.S. Imports from OPEC Countries of Liquified Petroleum Gases (Thousand Barrels) | ||||||||
| Year | Jan | Feb | Mar | Apr | May | Jun | Jul | Aug | Sep | Oct | Nov | Dec |
|---|---|---|---|---|---|---|---|---|---|---|---|---|
| 1995 | 428 | 115 | 402 | 1,198 | 551 | 1,918 | 987 | 1,810 | 2,376 | 797 | 368 | |
| 1996 | 1,374 | 354 | 1,120 | 368 | 1,050 | 1,596 | 2,486 | 2,817 | 2,195 | 2,030 | 939 | 400 |
| 1997 | 651 | 400 | 1,324 | 1,785 | 2,048 | 1,767 | 1,294 | 1,761 | 1,377 | 1,134 | 210 | 1,716 |
| 1998 | 1,139 | 3,377 | 1,804 | 3,046 | 2,817 | 3,304 | 2,571 | 2,805 | 1,377 | 752 | 368 | |
| 1999 | 20 | 393 | 1,682 | 751 | 739 | 579 | 1,476 | 298 | 763 | 1,005 | ||
| 2000 | 354 | 790 | 462 | 106 | 563 | 1,749 | 1,091 | 354 | 365 | 753 | 920 | |
| 2001 | 2,331 | 1,646 | 1,088 | 2,769 | 2,652 | 3,937 | 468 | 1,593 | 603 | 524 | 197 | 921 |
| 2002 | 617 | 1,124 | 1,244 | 1,800 | 892 | 1,322 | 399 | 649 | 39 | 398 | 399 | |
| 2003 | 405 | 1,343 | 1,502 | 3,216 | 4,040 | 4,793 | 1,147 | 1,990 | 940 | 1,062 | 511 | |
| 2004 | 1,303 | 3,421 | 2,359 | 551 | 2,175 | 2,106 | 5,080 | 3,495 | 5,711 | 1,483 | 1,334 | 1,310 |
| 2005 | 1,625 | 1,604 | 1,028 | 2,719 | 3,315 | 1,674 | 4,666 | 3,939 | 3,491 | 6,515 | 5,697 | 2,126 |
| 2006 | 1,915 | 745 | 529 | 3,584 | 4,934 | 6,747 | 4,886 | 5,879 | 5,757 | 4,743 | 2,050 | 1,106 |
| 2007 | 3,064 | 1,046 | 2,060 | 2,264 | 3,306 | 3,472 | 1,141 | 2,047 | 4,184 | 2,844 | 2,909 | 1,648 |
| 2008 | 2,290 | 1,648 | 607 | 2,339 | 2,107 | 1,647 | 2,479 | 5,059 | 4,047 | 1,721 | 891 | 1,749 |
| 2009 | 1,411 | 1,855 | 1,970 | 1,406 | 1,218 | 269 | 1,219 | 426 | 987 | 1,293 | 1,203 | 1,753 |
| 2010 | 881 | 1,723 | 789 | 497 | 827 | 388 | 30 | 107 | 142 | 470 | 500 | 2,085 |
| 2011 | 1,151 | 886 | 637 | 665 | 166 | 215 | 662 | 784 | ||||
| 2012 | 94 | 63 | 412 | 373 | 548 | |||||||
| 2014 | 13 | |||||||||||
| 2016 | 577 | |||||||||||
| 2017 | 30 | |||||||||||
| 2018 | 140 | |||||||||||
| 2019 | 74 | 90 | 224 | 109 | ||||||||
| 2020 | 259 | 10 | 100 | 80 | 293 | 47 | 149 | 56 | 26 | 29 | 56 | 55 |
| 2021 | 54 | 57 | 54 | 144 | 245 | 110 | 311 | |||||
| 2022 | -- | -- | -- | -- | -- | -- | -- | -- | -- | |||
| 2023 | -- | -- | -- | -- | -- | -- | -- | -- | -- | -- | -- | -- |
| - = No Data Reported; -- = Not Applicable; NA = Not Available; W = Withheld to avoid disclosure of individual company data. |
| Release Date: 4/30/2024 |
| Next Release Date: 5/31/2024 |