|
Download Data (XLS File) |
|
||||||||
|
||||||||
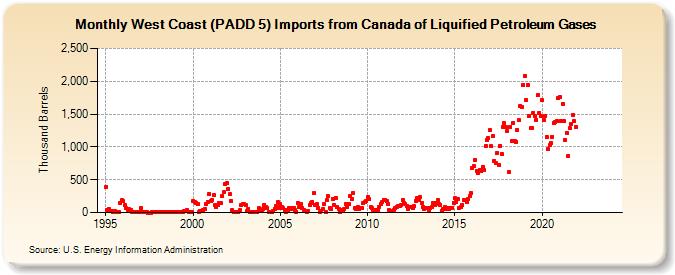
| West Coast (PADD 5) Imports from Canada of Liquified Petroleum Gases (Thousand Barrels) | ||||||||
| Year | Jan | Feb | Mar | Apr | May | Jun | Jul | Aug | Sep | Oct | Nov | Dec |
|---|---|---|---|---|---|---|---|---|---|---|---|---|
| 1995 | 396 | 45 | 59 | 30 | 26 | 4 | 21 | 3 | 3 | 13 | 152 | 185 |
| 1996 | 172 | 117 | 63 | 46 | 47 | 32 | 11 | 3 | 4 | 10 | 5 | 15 |
| 1997 | 67 | 5 | 2 | 1 | 1 | 0 | 0 | 0 | 1 | 13 | 4 | 4 |
| 1998 | 5 | 3 | 1 | 3 | 1 | 1 | 3 | 4 | 1 | 2 | 3 | 6 |
| 1999 | 5 | 2 | 11 | 5 | 1 | 9 | 27 | 21 | 34 | 8 | 15 | 9 |
| 2000 | 182 | 154 | 143 | 136 | 12 | 19 | 26 | 45 | 52 | 134 | 167 | 281 |
| 2001 | 174 | 190 | 269 | 114 | 85 | 110 | 146 | 148 | 252 | 307 | 434 | 448 |
| 2002 | 359 | 278 | 180 | 35 | 9 | 7 | 7 | 8 | 37 | 115 | 125 | 128 |
| 2003 | 111 | 18 | 58 | 5 | 2 | 1 | 2 | 13 | 5 | 65 | 26 | 39 |
| 2004 | 54 | 120 | 87 | 67 | 14 | 3 | 4 | 20 | 59 | 93 | 160 | 65 |
| 2005 | 123 | 82 | 69 | 32 | 10 | 46 | 77 | 59 | 65 | 74 | 38 | 10 |
| 2006 | 151 | 78 | 126 | 73 | 45 | 17 | 16 | 20 | 115 | 140 | 161 | 296 |
| 2007 | 109 | 125 | 74 | 8 | 19 | 56 | 123 | 8 | 186 | 248 | 73 | 57 |
| 2008 | 211 | 116 | 226 | 88 | 58 | 12 | 36 | 26 | 61 | 131 | 89 | 128 |
| 2009 | 254 | 206 | 301 | 72 | 58 | 82 | 58 | 65 | 64 | 151 | 156 | 171 |
| 2010 | 236 | 200 | 87 | 67 | 39 | 41 | 39 | 42 | 92 | 131 | 161 | 195 |
| 2011 | 192 | 174 | 137 | 39 | 23 | 18 | 39 | 67 | 88 | 107 | 105 | 120 |
| 2012 | 192 | 151 | 123 | 104 | 49 | 79 | 88 | 68 | 97 | 183 | 218 | 195 |
| 2013 | 232 | 152 | 83 | 51 | 69 | 71 | 40 | 74 | 82 | 144 | 111 | 147 |
| 2014 | 188 | 130 | 111 | 23 | 48 | 83 | 58 | 62 | 51 | 73 | 76 | 151 |
| 2015 | 216 | 166 | 202 | 75 | 78 | 118 | 195 | 192 | 161 | 202 | 247 | 294 |
| 2016 | 682 | 703 | 800 | 630 | 609 | 650 | 626 | 701 | 645 | 1,015 | 1,110 | 1,135 |
| 2017 | 1,251 | 1,006 | 1,165 | 792 | 757 | 911 | 717 | 1,019 | 893 | 1,307 | 1,359 | 1,305 |
| 2018 | 1,247 | 611 | 1,307 | 1,085 | 1,358 | 1,091 | 1,071 | 1,258 | 1,402 | 1,629 | 1,614 | 1,939 |
| 2019 | 2,085 | 1,709 | 1,946 | 1,469 | 1,282 | 1,294 | 1,519 | 1,473 | 1,413 | 1,786 | 1,517 | 1,468 |
| 2020 | 1,709 | 1,411 | 1,471 | 1,151 | 971 | 1,032 | 1,059 | 1,156 | 1,366 | 1,386 | 1,398 | 1,739 |
| 2021 | 1,760 | 1,396 | 1,660 | 1,389 | 1,109 | 1,213 | 865 | 1,284 | 1,352 | 1,490 | 1,390 | 1,299 |
| 2022 | -- | -- | -- | -- | -- | -- | -- | -- | -- | -- | -- | -- |
| 2023 | -- | -- | -- | -- | -- | -- | -- | -- | -- | -- | -- | -- |
| 2024 | -- | |||||||||||
| - = No Data Reported; -- = Not Applicable; NA = Not Available; W = Withheld to avoid disclosure of individual company data. |
| Release Date: 3/29/2024 |
| Next Release Date: 4/30/2024 |