|
Download Data (XLS File) |
|
||||||||
|
||||||||
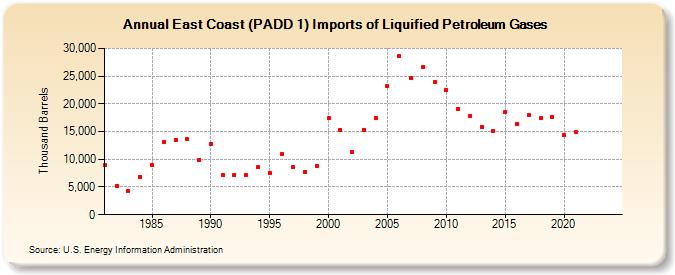
| East Coast (PADD 1) Imports of Liquified Petroleum Gases (Thousand Barrels) | ||||||||
| Decade | Year-0 | Year-1 | Year-2 | Year-3 | Year-4 | Year-5 | Year-6 | Year-7 | Year-8 | Year-9 |
|---|---|---|---|---|---|---|---|---|---|---|
| 1980's | 8,903 | 5,230 | 4,326 | 6,889 | 8,900 | 13,099 | 13,466 | 13,594 | 9,886 | |
| 1990's | 12,792 | 7,081 | 7,227 | 7,150 | 8,537 | 7,544 | 10,909 | 8,649 | 7,786 | 8,838 |
| 2000's | 17,361 | 15,259 | 11,224 | 15,307 | 17,445 | 23,191 | 28,674 | 24,656 | 26,691 | 23,943 |
| 2010's | 22,455 | 19,121 | 17,858 | 15,907 | 15,010 | 18,494 | 16,342 | 18,025 | 17,407 | 17,670 |
| 2020's | 14,385 | 14,926 | -- | -- |
| - = No Data Reported; -- = Not Applicable; NA = Not Available; W = Withheld to avoid disclosure of individual company data. |
| Release Date: 8/30/2024 |
| Next Release Date: 8/29/2025 |