|
Download Data (XLS File) |
|
||||||||
|
||||||||
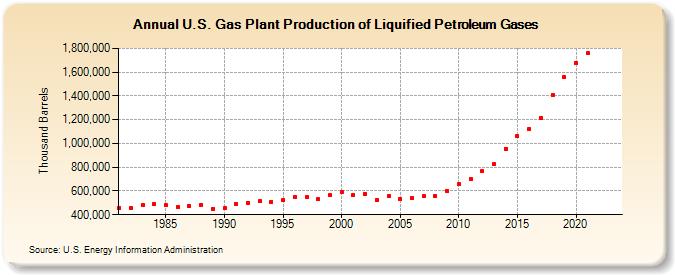
| U.S. Gas Plant Production of Liquified Petroleum Gases (Thousand Barrels) | ||||||||
| Decade | Year-0 | Year-1 | Year-2 | Year-3 | Year-4 | Year-5 | Year-6 | Year-7 | Year-8 | Year-9 |
|---|---|---|---|---|---|---|---|---|---|---|
| 1980's | 458,566 | 458,993 | 479,578 | 488,244 | 479,320 | 466,236 | 474,461 | 482,576 | 451,338 | |
| 1990's | 456,216 | 487,511 | 499,745 | 511,666 | 511,079 | 521,099 | 546,677 | 547,250 | 529,316 | 564,490 |
| 2000's | 587,297 | 569,998 | 576,915 | 527,110 | 560,700 | 529,485 | 538,819 | 554,895 | 556,292 | 598,220 |
| 2010's | 655,864 | 702,581 | 765,304 | 824,248 | 956,467 | 1,061,560 | 1,125,633 | 1,215,312 | 1,410,946 | 1,557,694 |
| 2020's | 1,680,266 | 1,757,699 | -- | -- |
| - = No Data Reported; -- = Not Applicable; NA = Not Available; W = Withheld to avoid disclosure of individual company data. |
| Release Date: 3/29/2024 |
| Next Release Date: 8/30/2024 |