|
Download Data (XLS File) |
|
||||||||
|
||||||||
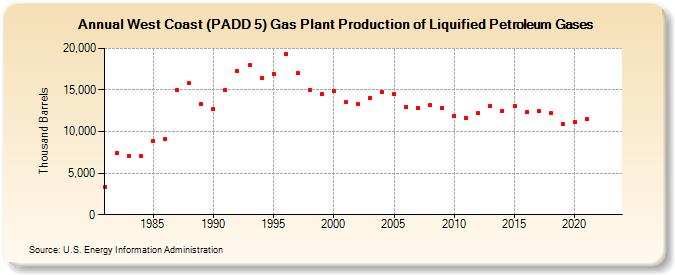
| West Coast (PADD 5) Gas Plant Production of Liquified Petroleum Gases (Thousand Barrels) | ||||||||
| Decade | Year-0 | Year-1 | Year-2 | Year-3 | Year-4 | Year-5 | Year-6 | Year-7 | Year-8 | Year-9 |
|---|---|---|---|---|---|---|---|---|---|---|
| 1980's | 3,297 | 7,413 | 7,116 | 7,017 | 8,813 | 9,104 | 14,980 | 15,838 | 13,268 | |
| 1990's | 12,684 | 15,025 | 17,264 | 17,961 | 16,441 | 16,965 | 19,353 | 17,041 | 15,001 | 14,555 |
| 2000's | 14,832 | 13,504 | 13,325 | 14,041 | 14,763 | 14,528 | 13,007 | 12,812 | 13,147 | 12,817 |
| 2010's | 11,890 | 11,662 | 12,209 | 13,121 | 12,454 | 13,087 | 12,310 | 12,478 | 12,184 | 10,873 |
| 2020's | 11,116 | 11,490 | -- | -- |
| - = No Data Reported; -- = Not Applicable; NA = Not Available; W = Withheld to avoid disclosure of individual company data. |
| Release Date: 3/29/2024 |
| Next Release Date: 8/30/2024 |