|
Download Data (XLS File) |
|
||||||||
|
||||||||
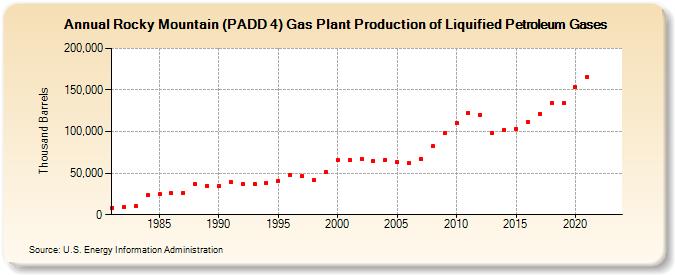
| Rocky Mountain (PADD 4) Gas Plant Production of Liquified Petroleum Gases (Thousand Barrels) | ||||||||
| Decade | Year-0 | Year-1 | Year-2 | Year-3 | Year-4 | Year-5 | Year-6 | Year-7 | Year-8 | Year-9 |
|---|---|---|---|---|---|---|---|---|---|---|
| 1980's | 8,412 | 9,447 | 10,162 | 23,570 | 24,835 | 25,595 | 26,501 | 36,593 | 34,895 | |
| 1990's | 34,913 | 39,420 | 37,038 | 37,013 | 38,443 | 40,911 | 48,291 | 46,603 | 41,688 | 51,234 |
| 2000's | 65,566 | 66,125 | 67,309 | 64,371 | 66,276 | 62,852 | 62,219 | 67,252 | 82,221 | 97,954 |
| 2010's | 110,492 | 122,766 | 120,252 | 98,528 | 102,422 | 103,250 | 111,799 | 121,424 | 133,814 | 134,182 |
| 2020's | 153,963 | 165,661 | -- | -- |
| - = No Data Reported; -- = Not Applicable; NA = Not Available; W = Withheld to avoid disclosure of individual company data. |
| Release Date: 8/30/2024 |
| Next Release Date: 8/29/2025 |