|
Download Data (XLS File) |
|
||||||||
|
||||||||
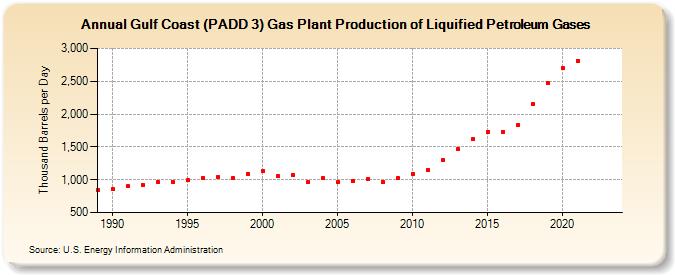
| Gulf Coast (PADD 3) Gas Plant Production of Liquified Petroleum Gases (Thousand Barrels per Day) | ||||||||
| Decade | Year-0 | Year-1 | Year-2 | Year-3 | Year-4 | Year-5 | Year-6 | Year-7 | Year-8 | Year-9 |
|---|---|---|---|---|---|---|---|---|---|---|
| 1980's | 843 | |||||||||
| 1990's | 855 | 899 | 925 | 960 | 960 | 989 | 1,026 | 1,045 | 1,024 | 1,093 |
| 2000's | 1,128 | 1,054 | 1,074 | 959 | 1,021 | 959 | 985 | 1,013 | 968 | 1,020 |
| 2010's | 1,094 | 1,149 | 1,295 | 1,465 | 1,615 | 1,730 | 1,727 | 1,833 | 2,146 | 2,466 |
| 2020's | 2,702 | 2,813 | -- | -- |
| - = No Data Reported; -- = Not Applicable; NA = Not Available; W = Withheld to avoid disclosure of individual company data. |
| Release Date: 3/29/2024 |
| Next Release Date: 8/30/2024 |