|
Download Data (XLS File) |
|
||||||||
|
||||||||
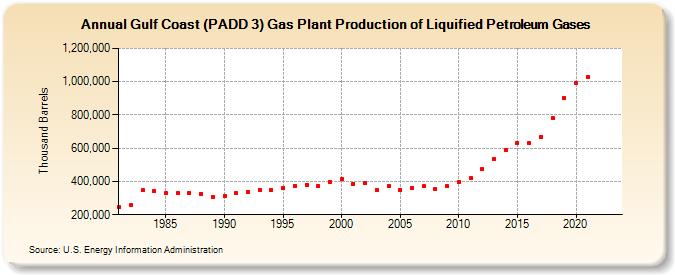
| Gulf Coast (PADD 3) Gas Plant Production of Liquified Petroleum Gases (Thousand Barrels) | ||||||||
| Decade | Year-0 | Year-1 | Year-2 | Year-3 | Year-4 | Year-5 | Year-6 | Year-7 | Year-8 | Year-9 |
|---|---|---|---|---|---|---|---|---|---|---|
| 1980's | 244,920 | 256,361 | 347,047 | 342,922 | 327,714 | 328,028 | 330,419 | 327,524 | 307,736 | |
| 1990's | 312,122 | 328,142 | 338,612 | 350,538 | 350,290 | 361,143 | 375,523 | 381,348 | 373,784 | 398,804 |
| 2000's | 412,881 | 384,840 | 391,976 | 350,034 | 373,694 | 350,117 | 359,401 | 369,701 | 354,279 | 372,269 |
| 2010's | 399,349 | 419,378 | 474,114 | 534,569 | 589,296 | 631,576 | 632,221 | 668,926 | 783,304 | 900,263 |
| 2020's | 988,939 | 1,026,759 | -- | -- |
| - = No Data Reported; -- = Not Applicable; NA = Not Available; W = Withheld to avoid disclosure of individual company data. |
| Release Date: 3/29/2024 |
| Next Release Date: 8/30/2024 |