|
Download Data (XLS File) |
|
||||||||
|
||||||||
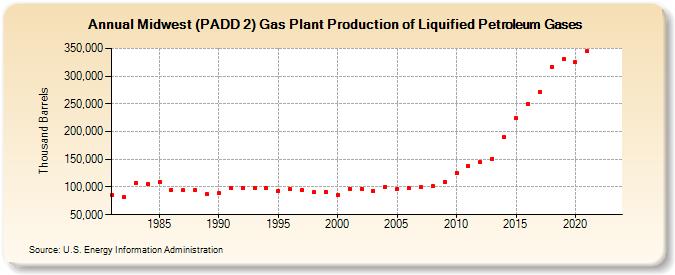
| Midwest (PADD 2) Gas Plant Production of Liquified Petroleum Gases (Thousand Barrels) | ||||||||
| Decade | Year-0 | Year-1 | Year-2 | Year-3 | Year-4 | Year-5 | Year-6 | Year-7 | Year-8 | Year-9 |
|---|---|---|---|---|---|---|---|---|---|---|
| 1980's | 84,951 | 81,899 | 106,975 | 105,341 | 108,696 | 95,338 | 94,552 | 94,034 | 86,671 | |
| 1990's | 88,693 | 97,309 | 98,725 | 97,376 | 97,425 | 93,651 | 96,717 | 93,815 | 90,346 | 91,570 |
| 2000's | 85,675 | 97,203 | 97,035 | 93,086 | 100,499 | 96,786 | 97,679 | 99,169 | 101,008 | 109,085 |
| 2010's | 126,098 | 138,077 | 145,009 | 151,343 | 189,511 | 223,922 | 250,402 | 271,525 | 317,034 | 331,145 |
| 2020's | 324,703 | 345,157 | -- | -- |
| - = No Data Reported; -- = Not Applicable; NA = Not Available; W = Withheld to avoid disclosure of individual company data. |
| Release Date: 3/29/2024 |
| Next Release Date: 8/30/2024 |