|
Download Data (XLS File) |
|
||||||||
|
||||||||
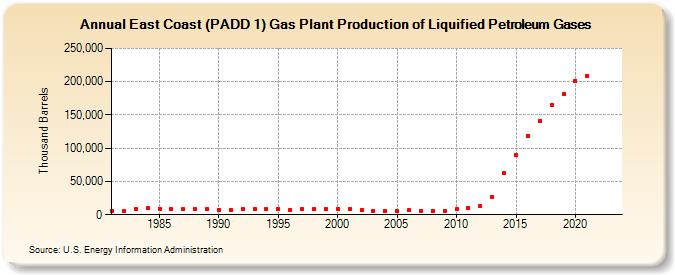
| East Coast (PADD 1) Gas Plant Production of Liquified Petroleum Gases (Thousand Barrels) | ||||||||
| Decade | Year-0 | Year-1 | Year-2 | Year-3 | Year-4 | Year-5 | Year-6 | Year-7 | Year-8 | Year-9 |
|---|---|---|---|---|---|---|---|---|---|---|
| 1980's | 6,185 | 5,429 | 8,278 | 9,394 | 9,262 | 8,171 | 8,009 | 8,587 | 8,768 | |
| 1990's | 7,804 | 7,615 | 8,106 | 8,778 | 8,480 | 8,429 | 6,793 | 8,443 | 8,497 | 8,327 |
| 2000's | 8,343 | 8,326 | 7,270 | 5,578 | 5,468 | 5,202 | 6,513 | 5,961 | 5,637 | 6,095 |
| 2010's | 8,035 | 10,698 | 13,720 | 26,687 | 62,784 | 89,725 | 118,901 | 140,959 | 164,610 | 181,231 |
| 2020's | 201,545 | 208,632 | -- | -- |
| - = No Data Reported; -- = Not Applicable; NA = Not Available; W = Withheld to avoid disclosure of individual company data. |
| Release Date: 3/29/2024 |
| Next Release Date: 8/30/2024 |