|
Download Data (XLS File) |
|
||||||||
|
||||||||
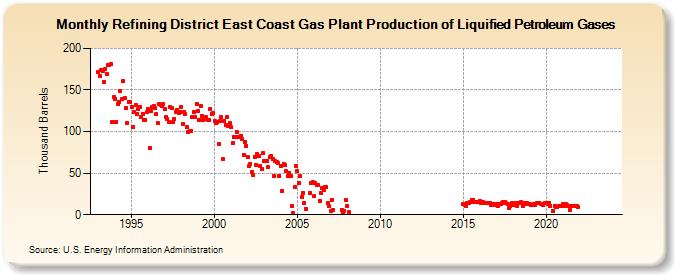
| Refining District East Coast Gas Plant Production of Liquified Petroleum Gases (Thousand Barrels) | ||||||||
| Year | Jan | Feb | Mar | Apr | May | Jun | Jul | Aug | Sep | Oct | Nov | Dec |
|---|---|---|---|---|---|---|---|---|---|---|---|---|
| 1993 | 172 | 167 | 174 | 173 | 160 | 175 | 169 | 180 | 180 | 181 | 112 | 141 |
| 1994 | 139 | 112 | 133 | 136 | 149 | 139 | 161 | 140 | 128 | 110 | 136 | 136 |
| 1995 | 130 | 106 | 123 | 132 | 121 | 127 | 130 | 117 | 121 | 114 | 114 | 123 |
| 1996 | 127 | 80 | 125 | 130 | 131 | 128 | 121 | 110 | 133 | 132 | 131 | 133 |
| 1997 | 127 | 118 | 115 | 112 | 129 | 128 | 111 | 115 | 124 | 126 | 122 | 123 |
| 1998 | 129 | 109 | 123 | 121 | 105 | 100 | 101 | 101 | 117 | 124 | 118 | 133 |
| 1999 | 125 | 114 | 131 | 119 | 114 | 115 | 117 | 114 | 114 | 127 | 121 | 122 |
| 2000 | 113 | 110 | 111 | 85 | 113 | 117 | 67 | 113 | 108 | 117 | 107 | 110 |
| 2001 | 105 | 86 | 93 | 93 | 99 | 93 | 93 | 95 | 91 | 72 | 88 | 83 |
| 2002 | 70 | 59 | 61 | 51 | 48 | 70 | 60 | 73 | 71 | 58 | 55 | 74 |
| 2003 | 64 | 64 | 65 | 57 | 69 | 71 | 67 | 47 | 65 | 63 | 62 | 47 |
| 2004 | 59 | 29 | 61 | 60 | 52 | 46 | 50 | 46 | 11 | 2 | 33 | 59 |
| 2005 | 52 | 38 | 46 | 21 | 26 | 14 | 7 | 26 | 38 | 39 | ||
| 2006 | 22 | 38 | 36 | 36 | 17 | 26 | 32 | 30 | 33 | 33 | 14 | 10 |
| 2007 | 5 | 18 | 6 | 6 | 3 | 5 | 18 | |||||
| 2008 | 11 | 3 | ||||||||||
| 2015 | 13 | 12 | 11 | 14 | 14 | 15 | 18 | 18 | 15 | 15 | 15 | 15 |
| 2016 | 16 | 14 | 15 | 14 | 14 | 14 | 14 | 14 | 12 | 13 | 13 | 12 |
| 2017 | 13 | 11 | 13 | 13 | 14 | 15 | 15 | 14 | 13 | 8 | 11 | 14 |
| 2018 | 12 | 13 | 14 | 11 | 14 | 14 | 15 | 10 | 13 | 14 | 14 | 13 |
| 2019 | 13 | 12 | 12 | 13 | 12 | 14 | 14 | 14 | 13 | 13 | 12 | 14 |
| 2020 | 14 | 13 | 14 | 11 | 5 | 11 | 9 | 9 | 11 | 11 | 11 | |
| 2021 | 13 | 11 | 13 | 12 | 11 | 6 | 11 | 11 | 11 | 11 | 11 | 9 |
| 2022 | -- | -- | -- | -- | -- | -- | -- | -- | -- | -- | -- | -- |
| 2023 | -- | -- | -- | -- | -- | -- | -- | -- | -- | -- | -- | -- |
| 2024 | -- | |||||||||||
| - = No Data Reported; -- = Not Applicable; NA = Not Available; W = Withheld to avoid disclosure of individual company data. |
| Release Date: 3/29/2024 |
| Next Release Date: 4/30/2024 |