|
Download Data (XLS File) |
|
||||||||
|
||||||||
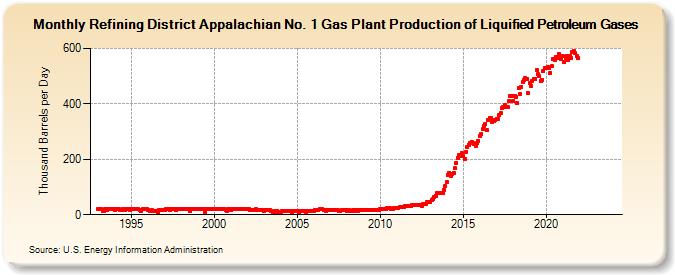
| Refining District Appalachian No. 1 Gas Plant Production of Liquified Petroleum Gases (Thousand Barrels per Day) | ||||||||
| Year | Jan | Feb | Mar | Apr | May | Jun | Jul | Aug | Sep | Oct | Nov | Dec |
|---|---|---|---|---|---|---|---|---|---|---|---|---|
| 1993 | 20 | 20 | 19 | 15 | 15 | 19 | 18 | 19 | 19 | 20 | 20 | 19 |
| 1994 | 17 | 20 | 19 | 19 | 18 | 16 | 19 | 17 | 21 | 21 | 21 | 18 |
| 1995 | 19 | 19 | 20 | 20 | 19 | 20 | 18 | 14 | 20 | 20 | 20 | 19 |
| 1996 | 18 | 14 | 15 | 16 | 14 | 14 | 14 | 6 | 16 | 16 | 16 | 16 |
| 1997 | 18 | 19 | 20 | 20 | 17 | 20 | 20 | 20 | 17 | 20 | 20 | 19 |
| 1998 | 20 | 20 | 20 | 19 | 19 | 20 | 14 | 20 | 20 | 20 | 22 | 20 |
| 1999 | 19 | 20 | 19 | 20 | 19 | 9 | 19 | 20 | 20 | 21 | 21 | 20 |
| 2000 | 20 | 20 | 21 | 21 | 20 | 20 | 21 | 21 | 16 | 14 | 20 | 19 |
| 2001 | 18 | 19 | 20 | 20 | 19 | 20 | 20 | 20 | 20 | 21 | 21 | 20 |
| 2002 | 19 | 19 | 18 | 17 | 17 | 17 | 19 | 18 | 18 | 18 | 16 | 18 |
| 2003 | 13 | 17 | 18 | 17 | 18 | 15 | 8 | 8 | 13 | 14 | 9 | 9 |
| 2004 | 9 | 12 | 13 | 15 | 14 | 15 | 13 | 15 | 11 | 15 | 15 | 15 |
| 2005 | 14 | 11 | 14 | 13 | 14 | 14 | 11 | 14 | 14 | 14 | 14 | 14 |
| 2006 | 15 | 17 | 17 | 16 | 21 | 20 | 19 | 16 | 16 | 14 | 17 | 16 |
| 2007 | 16 | 18 | 17 | 18 | 17 | 16 | 15 | 14 | 16 | 16 | 16 | 16 |
| 2008 | 15 | 16 | 15 | 14 | 16 | 15 | 16 | 16 | 13 | 16 | 16 | 16 |
| 2009 | 16 | 16 | 17 | 16 | 16 | 16 | 17 | 17 | 16 | 18 | 18 | 17 |
| 2010 | 20 | 20 | 22 | 21 | 22 | 23 | 23 | 23 | 19 | 21 | 26 | 24 |
| 2011 | 24 | 26 | 27 | 28 | 28 | 29 | 30 | 30 | 30 | 30 | 33 | 36 |
| 2012 | 36 | 35 | 34 | 34 | 35 | 36 | 33 | 37 | 39 | 40 | 45 | 47 |
| 2013 | 47 | 53 | 56 | 65 | 69 | 77 | 80 | 79 | 78 | 80 | 90 | 103 |
| 2014 | 119 | 142 | 151 | 141 | 148 | 151 | 167 | 187 | 206 | 216 | 211 | 222 |
| 2015 | 211 | 201 | 227 | 243 | 253 | 258 | 264 | 258 | 255 | 249 | 257 | 267 |
| 2016 | 284 | 291 | 308 | 319 | 328 | 304 | 342 | 348 | 350 | 336 | 338 | 343 |
| 2017 | 347 | 346 | 360 | 366 | 384 | 388 | 394 | 389 | 388 | 409 | 427 | 429 |
| 2018 | 412 | 427 | 423 | 404 | 457 | 436 | 461 | 479 | 485 | 493 | 490 | 438 |
| 2019 | 476 | 465 | 484 | 489 | 490 | 522 | 506 | 499 | 484 | 486 | 518 | 531 |
| 2020 | 528 | 532 | 528 | 512 | 535 | 563 | 557 | 570 | 567 | 580 | 569 | 563 |
| 2021 | 571 | 550 | 567 | 574 | 558 | 572 | 565 | 586 | 590 | 582 | 573 | 566 |
| 2022 | -- | -- | -- | -- | -- | -- | -- | -- | -- | -- | -- | -- |
| 2023 | -- | -- | -- | -- | -- | -- | -- | -- | -- | -- | -- | -- |
| 2024 | -- | |||||||||||
| - = No Data Reported; -- = Not Applicable; NA = Not Available; W = Withheld to avoid disclosure of individual company data. |
| Release Date: 3/29/2024 |
| Next Release Date: 4/30/2024 |