|
Download Data (XLS File) |
|
||||||||
|
||||||||
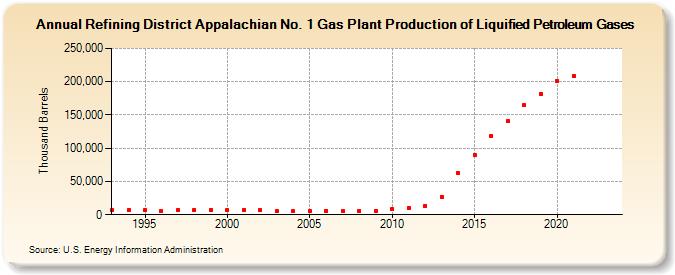
| Refining District Appalachian No. 1 Gas Plant Production of Liquified Petroleum Gases (Thousand Barrels) | ||||||||
| Decade | Year-0 | Year-1 | Year-2 | Year-3 | Year-4 | Year-5 | Year-6 | Year-7 | Year-8 | Year-9 |
|---|---|---|---|---|---|---|---|---|---|---|
| 1990's | 6,794 | 6,861 | 6,971 | 5,312 | 6,993 | 7,116 | 6,894 | |||
| 2000's | 7,072 | 7,235 | 6,520 | 4,837 | 4,960 | 4,895 | 6,186 | 5,900 | 5,623 | 6,095 |
| 2010's | 8,035 | 10,698 | 13,720 | 26,687 | 62,784 | 89,550 | 118,736 | 140,805 | 164,453 | 181,075 |
| 2020's | 201,426 | 208,502 | -- | -- |
| - = No Data Reported; -- = Not Applicable; NA = Not Available; W = Withheld to avoid disclosure of individual company data. |
| Release Date: 8/30/2024 |
| Next Release Date: 8/29/2025 |