|
Download Data (XLS File) |
|
||||||||
|
||||||||
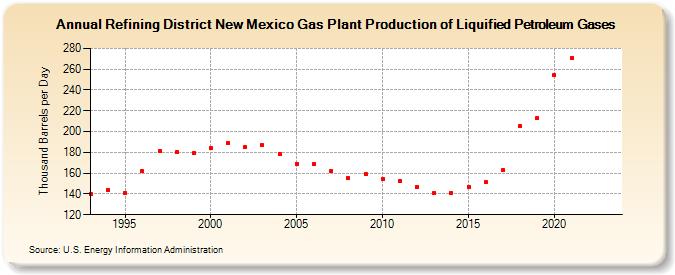
| Refining District New Mexico Gas Plant Production of Liquified Petroleum Gases (Thousand Barrels per Day) | ||||||||
| Decade | Year-0 | Year-1 | Year-2 | Year-3 | Year-4 | Year-5 | Year-6 | Year-7 | Year-8 | Year-9 |
|---|---|---|---|---|---|---|---|---|---|---|
| 1990's | 140 | 144 | 141 | 162 | 181 | 180 | 179 | |||
| 2000's | 184 | 189 | 185 | 187 | 178 | 169 | 169 | 162 | 155 | 159 |
| 2010's | 154 | 152 | 147 | 141 | 141 | 147 | 151 | 163 | 205 | 213 |
| 2020's | 254 | 271 | -- | -- |
| - = No Data Reported; -- = Not Applicable; NA = Not Available; W = Withheld to avoid disclosure of individual company data. |
| Release Date: 8/30/2024 |
| Next Release Date: 8/29/2025 |