|
Download Data (XLS File) |
|
||||||||
|
||||||||
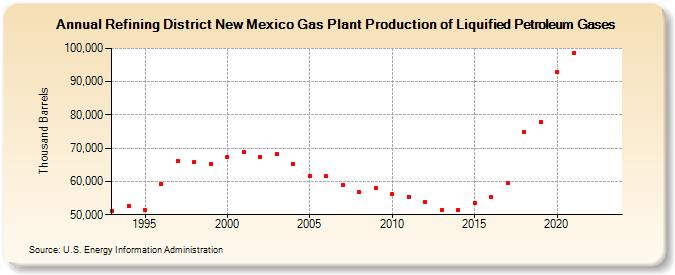
| Refining District New Mexico Gas Plant Production of Liquified Petroleum Gases (Thousand Barrels) | ||||||||
| Decade | Year-0 | Year-1 | Year-2 | Year-3 | Year-4 | Year-5 | Year-6 | Year-7 | Year-8 | Year-9 |
|---|---|---|---|---|---|---|---|---|---|---|
| 1990's | 51,106 | 52,717 | 51,559 | 59,326 | 66,173 | 65,790 | 65,227 | |||
| 2000's | 67,370 | 68,891 | 67,494 | 68,126 | 65,176 | 61,606 | 61,530 | 59,017 | 56,749 | 57,897 |
| 2010's | 56,285 | 55,471 | 53,936 | 51,558 | 51,354 | 53,567 | 55,216 | 59,557 | 75,007 | 77,844 |
| 2020's | 92,888 | 98,741 | -- | -- |
| - = No Data Reported; -- = Not Applicable; NA = Not Available; W = Withheld to avoid disclosure of individual company data. |
| Release Date: 8/30/2024 |
| Next Release Date: 8/29/2025 |