|
Download Data (XLS File) |
|
||||||||
|
||||||||
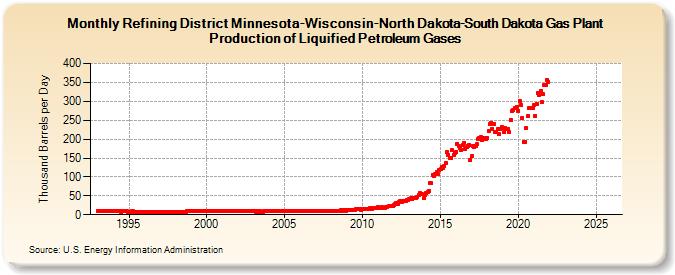
| Refining District Minnesota-Wisconsin-North Dakota-South Dakota Gas Plant Production of Liquified Petroleum Gases (Thousand Barrels per Day) | ||||||||
| Year | Jan | Feb | Mar | Apr | May | Jun | Jul | Aug | Sep | Oct | Nov | Dec |
|---|---|---|---|---|---|---|---|---|---|---|---|---|
| 1993 | 9 | 9 | 9 | 9 | 9 | 9 | 9 | 9 | 9 | 9 | 9 | 9 |
| 1994 | 9 | 9 | 9 | 9 | 9 | 9 | 8 | 9 | 9 | 9 | 9 | 8 |
| 1995 | 8 | 8 | 9 | 9 | 8 | 8 | 7 | 8 | 8 | 8 | 8 | 8 |
| 1996 | 8 | 7 | 7 | 8 | 8 | 7 | 8 | 7 | 8 | 8 | 8 | 7 |
| 1997 | 8 | 8 | 7 | 8 | 8 | 8 | 8 | 8 | 8 | 8 | 8 | 8 |
| 1998 | 8 | 7 | 8 | 8 | 8 | 8 | 8 | 8 | 8 | 9 | 9 | 9 |
| 1999 | 9 | 9 | 9 | 9 | 9 | 9 | 9 | 9 | 9 | 9 | 9 | 9 |
| 2000 | 9 | 9 | 9 | 9 | 9 | 9 | 9 | 9 | 9 | 10 | 9 | 9 |
| 2001 | 9 | 9 | 9 | 9 | 10 | 9 | 9 | 9 | 9 | 9 | 10 | 10 |
| 2002 | 9 | 9 | 9 | 9 | 9 | 9 | 9 | 9 | 9 | 9 | 9 | 9 |
| 2003 | 9 | 9 | 8 | 9 | 8 | 9 | 8 | 8 | 9 | 9 | 9 | 9 |
| 2004 | 9 | 9 | 9 | 9 | 9 | 9 | 9 | 9 | 9 | 9 | 9 | 10 |
| 2005 | 9 | 10 | 10 | 10 | 10 | 10 | 10 | 10 | 9 | 10 | 10 | 10 |
| 2006 | 10 | 10 | 10 | 10 | 10 | 10 | 10 | 11 | 11 | 11 | 11 | 11 |
| 2007 | 10 | 10 | 10 | 11 | 11 | 11 | 10 | 11 | 11 | 11 | 10 | 11 |
| 2008 | 11 | 10 | 10 | 11 | 11 | 11 | 11 | 12 | 11 | 12 | 12 | 9 |
| 2009 | 12 | 13 | 12 | 13 | 13 | 13 | 13 | 14 | 14 | 14 | 14 | 13 |
| 2010 | 14 | 14 | 15 | 15 | 16 | 15 | 17 | 16 | 18 | 18 | 18 | 17 |
| 2011 | 20 | 19 | 19 | 20 | 19 | 18 | 20 | 20 | 22 | 22 | 24 | 23 |
| 2012 | 25 | 28 | 30 | 28 | 34 | 35 | 34 | 35 | 36 | 37 | 39 | 40 |
| 2013 | 41 | 43 | 42 | 44 | 44 | 45 | 46 | 52 | 58 | 54 | 54 | 44 |
| 2014 | 53 | 57 | 60 | 64 | 83 | 83 | 106 | 102 | 107 | 113 | 107 | 118 |
| 2015 | 120 | 126 | 124 | 129 | 137 | 165 | 159 | 151 | 150 | 170 | 159 | 163 |
| 2016 | 167 | 187 | 183 | 177 | 172 | 185 | 191 | 173 | 178 | 182 | 185 | 146 |
| 2017 | 154 | 183 | 178 | 183 | 186 | 201 | 204 | 206 | 197 | 203 | 204 | 201 |
| 2018 | 203 | 222 | 240 | 243 | 227 | 241 | 220 | 218 | 226 | 213 | 228 | 231 |
| 2019 | 230 | 219 | 229 | 228 | 228 | 218 | 251 | 275 | 278 | 282 | 282 | 284 |
| 2020 | 275 | 300 | 291 | 256 | 192 | 192 | 229 | 260 | 281 | 283 | 283 | 281 |
| 2021 | 289 | 262 | 293 | 322 | 317 | 327 | 297 | 318 | 344 | 342 | 356 | 352 |
| 2022 | -- | -- | -- | -- | -- | -- | -- | -- | -- | -- | -- | -- |
| 2023 | -- | -- | -- | -- | -- | -- | -- | -- | -- | -- | -- | -- |
| 2024 | -- | |||||||||||
| - = No Data Reported; -- = Not Applicable; NA = Not Available; W = Withheld to avoid disclosure of individual company data. |
| Release Date: 3/29/2024 |
| Next Release Date: 4/30/2024 |