|
Download Data (XLS File) |
|
||||||||
|
||||||||
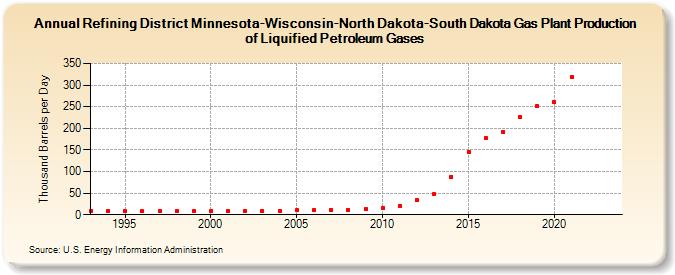
| Refining District Minnesota-Wisconsin-North Dakota-South Dakota Gas Plant Production of Liquified Petroleum Gases (Thousand Barrels per Day) | ||||||||
| Decade | Year-0 | Year-1 | Year-2 | Year-3 | Year-4 | Year-5 | Year-6 | Year-7 | Year-8 | Year-9 |
|---|---|---|---|---|---|---|---|---|---|---|
| 1990's | 9 | 9 | 8 | 8 | 8 | 8 | 9 | |||
| 2000's | 9 | 9 | 9 | 9 | 9 | 10 | 10 | 11 | 11 | 13 |
| 2010's | 16 | 21 | 33 | 47 | 88 | 146 | 177 | 192 | 226 | 251 |
| 2020's | 260 | 319 | -- | -- |
| - = No Data Reported; -- = Not Applicable; NA = Not Available; W = Withheld to avoid disclosure of individual company data. |
| Release Date: 8/30/2024 |
| Next Release Date: 8/29/2025 |