|
Download Data (XLS File) |
|
||||||||
|
||||||||
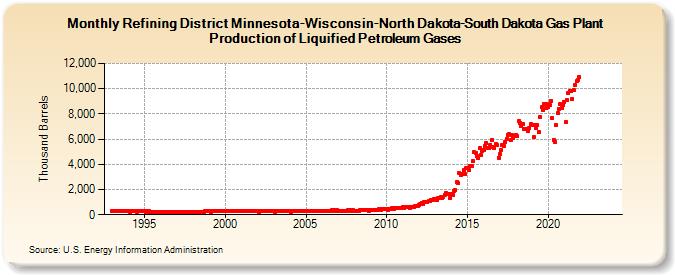
| Refining District Minnesota-Wisconsin-North Dakota-South Dakota Gas Plant Production of Liquified Petroleum Gases (Thousand Barrels) | ||||||||
| Year | Jan | Feb | Mar | Apr | May | Jun | Jul | Aug | Sep | Oct | Nov | Dec |
|---|---|---|---|---|---|---|---|---|---|---|---|---|
| 1993 | 278 | 256 | 276 | 267 | 283 | 278 | 289 | 289 | 279 | 290 | 282 | 283 |
| 1994 | 267 | 242 | 265 | 265 | 275 | 260 | 255 | 266 | 263 | 273 | 256 | 259 |
| 1995 | 260 | 233 | 273 | 263 | 251 | 241 | 215 | 240 | 247 | 251 | 238 | 244 |
| 1996 | 239 | 213 | 205 | 231 | 246 | 219 | 233 | 232 | 238 | 244 | 229 | 225 |
| 1997 | 234 | 217 | 231 | 232 | 250 | 235 | 245 | 254 | 235 | 244 | 237 | 247 |
| 1998 | 241 | 207 | 240 | 253 | 252 | 243 | 252 | 249 | 244 | 271 | 271 | 270 |
| 1999 | 264 | 245 | 270 | 262 | 269 | 268 | 268 | 278 | 268 | 276 | 274 | 284 |
| 2000 | 274 | 259 | 276 | 275 | 291 | 281 | 281 | 267 | 280 | 297 | 271 | 279 |
| 2001 | 292 | 261 | 291 | 275 | 300 | 274 | 291 | 294 | 283 | 293 | 285 | 296 |
| 2002 | 268 | 253 | 270 | 273 | 294 | 270 | 274 | 282 | 269 | 292 | 277 | 286 |
| 2003 | 273 | 246 | 259 | 256 | 259 | 260 | 261 | 263 | 269 | 276 | 277 | 286 |
| 2004 | 283 | 255 | 278 | 280 | 289 | 281 | 273 | 270 | 281 | 294 | 281 | 300 |
| 2005 | 287 | 269 | 313 | 299 | 302 | 293 | 295 | 304 | 282 | 311 | 309 | 309 |
| 2006 | 313 | 275 | 308 | 293 | 315 | 299 | 320 | 336 | 334 | 350 | 331 | 337 |
| 2007 | 312 | 283 | 320 | 316 | 329 | 315 | 319 | 345 | 318 | 349 | 314 | 336 |
| 2008 | 330 | 303 | 325 | 327 | 346 | 336 | 340 | 362 | 336 | 375 | 372 | 276 |
| 2009 | 377 | 356 | 378 | 378 | 392 | 389 | 418 | 432 | 413 | 425 | 419 | 415 |
| 2010 | 422 | 385 | 461 | 461 | 510 | 446 | 531 | 501 | 546 | 549 | 529 | 517 |
| 2011 | 605 | 535 | 602 | 600 | 601 | 548 | 631 | 634 | 650 | 676 | 706 | 715 |
| 2012 | 782 | 811 | 916 | 849 | 1,039 | 1,042 | 1,040 | 1,079 | 1,092 | 1,162 | 1,164 | 1,251 |
| 2013 | 1,256 | 1,201 | 1,293 | 1,306 | 1,378 | 1,348 | 1,433 | 1,599 | 1,750 | 1,683 | 1,619 | 1,358 |
| 2014 | 1,644 | 1,590 | 1,865 | 1,931 | 2,576 | 2,484 | 3,282 | 3,155 | 3,218 | 3,516 | 3,207 | 3,669 |
| 2015 | 3,722 | 3,531 | 3,846 | 3,860 | 4,258 | 4,956 | 4,932 | 4,669 | 4,506 | 5,260 | 4,758 | 5,057 |
| 2016 | 5,174 | 5,421 | 5,672 | 5,322 | 5,324 | 5,564 | 5,931 | 5,363 | 5,331 | 5,642 | 5,537 | 4,529 |
| 2017 | 4,779 | 5,123 | 5,507 | 5,475 | 5,762 | 6,040 | 6,313 | 6,379 | 5,921 | 6,300 | 6,108 | 6,223 |
| 2018 | 6,289 | 6,223 | 7,434 | 7,282 | 7,052 | 7,234 | 6,831 | 6,763 | 6,773 | 6,611 | 6,851 | 7,172 |
| 2019 | 7,130 | 6,129 | 7,109 | 6,849 | 7,080 | 6,536 | 7,791 | 8,527 | 8,330 | 8,757 | 8,455 | 8,789 |
| 2020 | 8,536 | 8,711 | 9,026 | 7,689 | 5,950 | 5,757 | 7,091 | 8,066 | 8,423 | 8,774 | 8,493 | 8,705 |
| 2021 | 8,945 | 7,339 | 9,098 | 9,654 | 9,812 | 9,819 | 9,220 | 9,860 | 10,319 | 10,595 | 10,682 | 10,917 |
| 2022 | -- | -- | -- | -- | -- | -- | -- | -- | -- | -- | -- | -- |
| 2023 | -- | -- | -- | -- | -- | -- | -- | -- | -- | -- | -- | -- |
| 2024 | -- | |||||||||||
| - = No Data Reported; -- = Not Applicable; NA = Not Available; W = Withheld to avoid disclosure of individual company data. |
| Release Date: 3/29/2024 |
| Next Release Date: 4/30/2024 |