|
Download Data (XLS File) |
|
||||||||
|
||||||||
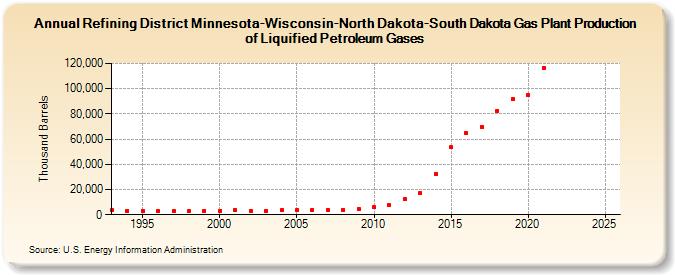
| Refining District Minnesota-Wisconsin-North Dakota-South Dakota Gas Plant Production of Liquified Petroleum Gases (Thousand Barrels) | ||||||||
| Decade | Year-0 | Year-1 | Year-2 | Year-3 | Year-4 | Year-5 | Year-6 | Year-7 | Year-8 | Year-9 |
|---|---|---|---|---|---|---|---|---|---|---|
| 1990's | 3,350 | 3,146 | 2,956 | 2,754 | 2,861 | 2,993 | 3,226 | |||
| 2000's | 3,331 | 3,435 | 3,308 | 3,185 | 3,365 | 3,573 | 3,811 | 3,856 | 4,028 | 4,792 |
| 2010's | 5,858 | 7,503 | 12,227 | 17,224 | 32,137 | 53,355 | 64,810 | 69,930 | 82,515 | 91,482 |
| 2020's | 95,221 | 116,260 | -- | -- |
| - = No Data Reported; -- = Not Applicable; NA = Not Available; W = Withheld to avoid disclosure of individual company data. |
| Release Date: 8/30/2024 |
| Next Release Date: 8/29/2025 |