|
Download Data (XLS File) |
|
||||||||
|
||||||||
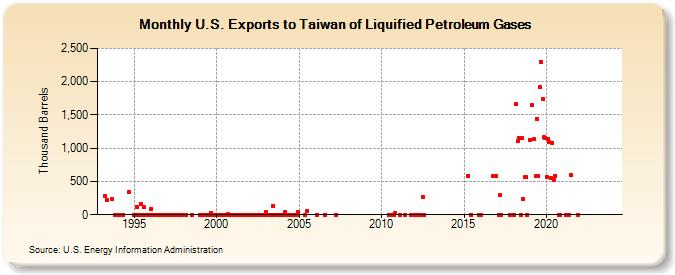
| U.S. Exports to Taiwan of Liquified Petroleum Gases (Thousand Barrels) | ||||||||
| Year | Jan | Feb | Mar | Apr | May | Jun | Jul | Aug | Sep | Oct | Nov | Dec |
|---|---|---|---|---|---|---|---|---|---|---|---|---|
| 1993 | 283 | 218 | 229 | 1 | ||||||||
| 1994 | 0 | 0 | 337 | |||||||||
| 1995 | 0 | 0 | 115 | 0 | 0 | 163 | 0 | 112 | 0 | 0 | 0 | 0 |
| 1996 | 91 | 0 | 0 | 0 | 0 | 0 | 0 | 0 | 0 | 0 | 0 | 0 |
| 1997 | 0 | 0 | 0 | 0 | 0 | 0 | 0 | 1 | 0 | 0 | 0 | 0 |
| 1998 | 0 | 0 | ||||||||||
| 1999 | 0 | 0 | 0 | 0 | 0 | 0 | 0 | 0 | 24 | 0 | 0 | 0 |
| 2000 | 0 | 0 | 0 | 0 | 0 | 0 | 0 | 0 | 7 | 0 | 0 | 0 |
| 2001 | 0 | 0 | 0 | 0 | 0 | 1 | 0 | 0 | 0 | 0 | 0 | 0 |
| 2002 | 0 | 2 | 1 | 0 | 0 | 0 | 0 | 0 | 0 | 0 | 0 | 0 |
| 2003 | 38 | 0 | 0 | 0 | 1 | 135 | 0 | 1 | 0 | 0 | 0 | 0 |
| 2004 | 0 | 0 | 41 | 0 | 0 | 1 | 0 | 0 | 0 | 0 | 0 | 35 |
| 2005 | 1 | 56 | ||||||||||
| 2006 | 0 | 0 | ||||||||||
| 2007 | 2 | |||||||||||
| 2010 | 0 | 0 | 0 | 24 | ||||||||
| 2011 | 0 | 0 | 0 | |||||||||
| 2012 | 0 | 0 | 0 | 0 | 0 | 260 | 0 | |||||
| 2015 | 588 | 0 | 0 | |||||||||
| 2016 | 0 | 579 | 577 | |||||||||
| 2017 | 0 | 299 | 0 | 0 | ||||||||
| 2018 | 0 | 1,658 | 1,102 | 1,150 | 0 | 1,152 | 229 | 573 | 563 | 0 | ||
| 2019 | 1,127 | 1,642 | 1,136 | 577 | 1,443 | 583 | 1,917 | 2,292 | 1,736 | 1,170 | 1,160 | |
| 2020 | 573 | 1,143 | 1,092 | 548 | 1,081 | 520 | 583 | 0 | 0 | |||
| 2021 | 0 | 0 | 0 | 590 | 0 | |||||||
| 2022 | -- | -- | ||||||||||
| 2023 | -- | -- | -- | -- | -- | -- | -- | |||||
| 2024 | -- | |||||||||||
| - = No Data Reported; -- = Not Applicable; NA = Not Available; W = Withheld to avoid disclosure of individual company data. |
| Release Date: 3/29/2024 |
| Next Release Date: 4/30/2024 |