|
Download Data (XLS File) |
|
||||||||
|
||||||||
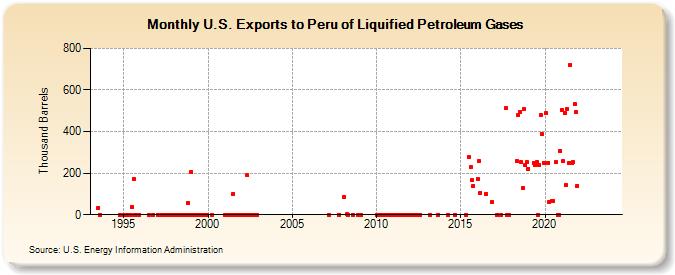
| U.S. Exports to Peru of Liquified Petroleum Gases (Thousand Barrels) | ||||||||
| Year | Jan | Feb | Mar | Apr | May | Jun | Jul | Aug | Sep | Oct | Nov | Dec |
|---|---|---|---|---|---|---|---|---|---|---|---|---|
| 1993 | 34 | 0 | ||||||||||
| 1994 | 1 | |||||||||||
| 1995 | 0 | 0 | 0 | 1 | 0 | 0 | 36 | 173 | 0 | 0 | 0 | 0 |
| 1996 | 0 | 0 | ||||||||||
| 1997 | 0 | 0 | 0 | 0 | 0 | 0 | 0 | 1 | 0 | 0 | 0 | 0 |
| 1998 | 0 | 0 | 0 | 0 | 0 | 0 | 0 | 0 | 0 | 0 | 58 | 0 |
| 1999 | 206 | 0 | 0 | 0 | 0 | 0 | 0 | 0 | 0 | 0 | 0 | 0 |
| 2000 | 0 | |||||||||||
| 2001 | 0 | 0 | 0 | 0 | 0 | 0 | 100 | 0 | 0 | 0 | 0 | 0 |
| 2002 | 0 | 0 | 0 | 0 | 189 | 0 | 0 | 0 | 0 | 0 | 0 | 0 |
| 2007 | 0 | 0 | ||||||||||
| 2008 | 87 | 2 | 1 | 0 | 0 | |||||||
| 2009 | 0 | 0 | ||||||||||
| 2010 | 0 | 1 | 0 | 1 | 0 | 1 | 1 | 1 | 1 | 0 | ||
| 2011 | 1 | 1 | 0 | 0 | 1 | 0 | 0 | 1 | 1 | 0 | 0 | 1 |
| 2012 | 0 | 0 | 0 | 1 | 1 | 1 | 1 | 1 | ||||
| 2013 | 0 | 0 | ||||||||||
| 2014 | 0 | 0 | ||||||||||
| 2015 | 0 | 276 | 230 | 165 | 140 | |||||||
| 2016 | 172 | 259 | 106 | 102 | 59 | |||||||
| 2017 | 0 | 0 | 511 | 0 | 0 | |||||||
| 2018 | 258 | 479 | 494 | 252 | 130 | 507 | 237 | 252 | ||||
| 2019 | 222 | 251 | 239 | 252 | 0 | 240 | 482 | 388 | 250 | |||
| 2020 | 489 | 249 | 62 | 68 | 66 | 252 | 0 | 0 | 307 | |||
| 2021 | 505 | 257 | 491 | 144 | 509 | 251 | 722 | 248 | 253 | 532 | 495 | 140 |
| 2022 | -- | -- | -- | -- | -- | -- | -- | -- | -- | -- | -- | -- |
| 2023 | -- | -- | -- | -- | -- | -- | -- | -- | -- | -- | -- | -- |
| 2024 | -- | |||||||||||
| - = No Data Reported; -- = Not Applicable; NA = Not Available; W = Withheld to avoid disclosure of individual company data. |
| Release Date: 3/29/2024 |
| Next Release Date: 4/30/2024 |