|
Download Data (XLS File) |
|
||||||||
|
||||||||
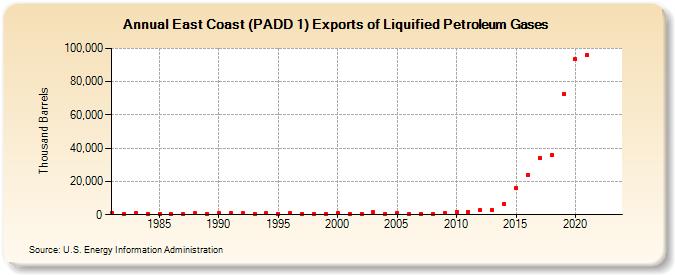
| East Coast (PADD 1) Exports of Liquified Petroleum Gases (Thousand Barrels) | ||||||||
| Decade | Year-0 | Year-1 | Year-2 | Year-3 | Year-4 | Year-5 | Year-6 | Year-7 | Year-8 | Year-9 |
|---|---|---|---|---|---|---|---|---|---|---|
| 1980's | 855 | 622 | 1,024 | 460 | 476 | 328 | 313 | 850 | 694 | |
| 1990's | 955 | 740 | 749 | 661 | 936 | 622 | 949 | 716 | 643 | 658 |
| 2000's | 992 | 578 | 620 | 1,364 | 708 | 1,039 | 463 | 698 | 648 | 1,139 |
| 2010's | 1,663 | 1,664 | 2,737 | 3,054 | 6,649 | 15,777 | 23,986 | 34,033 | 35,718 | 72,653 |
| 2020's | 93,342 | 95,881 | -- | -- |
| - = No Data Reported; -- = Not Applicable; NA = Not Available; W = Withheld to avoid disclosure of individual company data. |
| Release Date: 3/29/2024 |
| Next Release Date: 8/30/2024 |