|
Download Data (XLS File) |
|
||||||||
|
||||||||
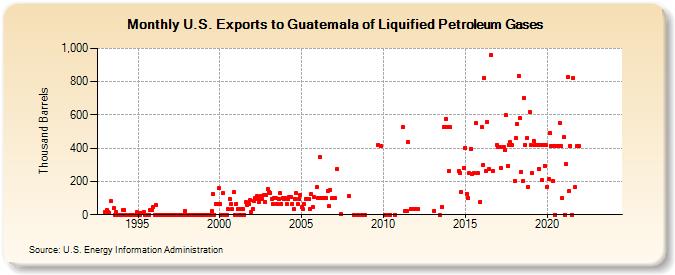
| U.S. Exports to Guatemala of Liquified Petroleum Gases (Thousand Barrels) | ||||||||
| Year | Jan | Feb | Mar | Apr | May | Jun | Jul | Aug | Sep | Oct | Nov | Dec |
|---|---|---|---|---|---|---|---|---|---|---|---|---|
| 1993 | 14 | 29 | 18 | 10 | 80 | 40 | 0 | 16 | 1 | 0 | ||
| 1994 | 0 | 29 | 28 | 0 | 0 | 0 | 0 | 0 | 0 | 15 | ||
| 1995 | 1 | 1 | 12 | 11 | 15 | 1 | 1 | 0 | 1 | 27 | 29 | 45 |
| 1996 | 1 | 56 | 1 | 0 | 0 | 0 | 1 | 0 | 1 | 0 | 0 | 0 |
| 1997 | 0 | 0 | 1 | 1 | 0 | 1 | 0 | 0 | 0 | 0 | 22 | 0 |
| 1998 | 0 | 0 | 0 | 0 | 0 | 0 | 0 | 0 | 0 | 0 | 0 | 1 |
| 1999 | 0 | 0 | 0 | 0 | 0 | 0 | 20 | 124 | 0 | 64 | 62 | 159 |
| 2000 | 65 | 1 | 129 | 0 | 1 | 1 | 32 | 96 | 65 | 32 | 134 | 0 |
| 2001 | 65 | 32 | 1 | 34 | 0 | 34 | 1 | 75 | 59 | 66 | 87 | 19 |
| 2002 | 33 | 84 | 98 | 110 | 95 | 79 | 114 | 97 | 116 | 79 | 121 | 152 |
| 2003 | 137 | 133 | 97 | 66 | 99 | 98 | 65 | 97 | 128 | 65 | 98 | 97 |
| 2004 | 98 | 65 | 92 | 104 | 104 | 65 | 33 | 97 | 128 | 63 | 97 | 118 |
| 2005 | 44 | 32 | 64 | 96 | 96 | 96 | 32 | 123 | 45 | 105 | 165 | |
| 2006 | 100 | 348 | 100 | 100 | 100 | 100 | 100 | 145 | 50 | 150 | 100 | 101 |
| 2007 | 100 | 274 | 2 | 114 | ||||||||
| 2008 | 1 | 0 | 0 | 0 | ||||||||
| 2009 | 418 | 411 | ||||||||||
| 2010 | 0 | 0 | 0 | 0 | ||||||||
| 2011 | 525 | 24 | 24 | 436 | 36 | 35 | 34 | |||||
| 2012 | 35 | |||||||||||
| 2013 | 24 | 0 | 48 | 525 | 525 | 576 | 525 | |||||
| 2014 | 263 | 525 | 260 | 251 | 137 | 281 | ||||||
| 2015 | 400 | 125 | 98 | 250 | 397 | 246 | 248 | 550 | 249 | 79 | ||
| 2016 | 525 | 299 | 824 | 260 | 559 | 272 | 960 | 260 | 420 | |||
| 2017 | 410 | 410 | 282 | 410 | 389 | 598 | 293 | 418 | 438 | 418 | ||
| 2018 | 205 | 461 | 546 | 836 | 579 | 258 | 200 | 702 | 419 | 459 | 168 | 618 |
| 2019 | 418 | 251 | 445 | 419 | 419 | 419 | 277 | 420 | 206 | 417 | 295 | 418 |
| 2020 | 168 | 214 | 492 | 412 | 200 | 412 | 1 | 412 | 413 | 552 | 412 | 100 |
| 2021 | 465 | 0 | 303 | 828 | 140 | 414 | 0 | 824 | 164 | 413 | 412 | |
| 2022 | -- | -- | -- | -- | -- | -- | -- | -- | -- | -- | ||
| 2023 | -- | -- | -- | -- | -- | -- | -- | -- | -- | -- | ||
| 2024 | -- | |||||||||||
| - = No Data Reported; -- = Not Applicable; NA = Not Available; W = Withheld to avoid disclosure of individual company data. |
| Release Date: 3/29/2024 |
| Next Release Date: 4/30/2024 |