|
Download Data (XLS File) |
|
||||||||
|
||||||||
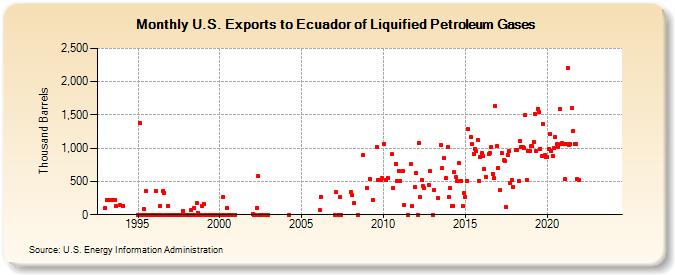
| U.S. Exports to Ecuador of Liquified Petroleum Gases (Thousand Barrels) | ||||||||
| Year | Jan | Feb | Mar | Apr | May | Jun | Jul | Aug | Sep | Oct | Nov | Dec |
|---|---|---|---|---|---|---|---|---|---|---|---|---|
| 1993 | 96 | 227 | 226 | 226 | 226 | 227 | 225 | 128 | 142 | |||
| 1994 | 135 | |||||||||||
| 1995 | 0 | 1,385 | 0 | 0 | 87 | 0 | 354 | 0 | 0 | 0 | 0 | 0 |
| 1996 | 0 | 355 | 0 | 0 | 130 | 0 | 354 | 326 | 0 | 0 | 136 | 0 |
| 1997 | 0 | 0 | 0 | 0 | 0 | 0 | 0 | 0 | 0 | 56 | 0 | 0 |
| 1998 | 0 | 0 | 0 | 76 | 0 | 106 | 0 | 172 | 32 | 0 | 0 | 138 |
| 1999 | 167 | 0 | 0 | 0 | 0 | 0 | 0 | 0 | 0 | 0 | 0 | 0 |
| 2000 | 0 | 0 | 265 | 0 | 0 | 102 | 0 | 0 | 0 | 0 | 0 | 0 |
| 2002 | 5 | 0 | 0 | 106 | 580 | 0 | 0 | 0 | 0 | 0 | 0 | 0 |
| 2004 | 0 | |||||||||||
| 2006 | 70 | 270 | ||||||||||
| 2007 | 0 | 335 | 0 | 260 | 0 | |||||||
| 2008 | 340 | 300 | 176 | 0 | 895 | |||||||
| 2009 | 400 | 535 | 225 | 1,024 | 525 | 525 | 525 | 550 | ||||
| 2010 | 1,070 | 520 | 550 | 910 | 400 | 759 | 500 | 651 | ||||
| 2011 | 508 | 650 | 141 | 0 | 756 | 124 | 415 | |||||
| 2012 | 625 | 0 | 1,075 | 261 | 525 | 428 | 395 | 446 | 652 | |||
| 2013 | 0 | 373 | 248 | 1,055 | 701 | 845 | 550 | 1,013 | ||||
| 2014 | 263 | 404 | 127 | 124 | 636 | 572 | 509 | 776 | 503 | 130 | 325 | |
| 2015 | 265 | 513 | 1,283 | 1,168 | 1,058 | 917 | 987 | 957 | 1,129 | 506 | 873 | |
| 2016 | 926 | 877 | 692 | 574 | 912 | 934 | 1,018 | 619 | 548 | 1,631 | 1,027 | |
| 2017 | 695 | 367 | 921 | 818 | 805 | 114 | 902 | 951 | 484 | 525 | 424 | |
| 2018 | 968 | 974 | 506 | 1,115 | 1,013 | 1,011 | 998 | 1,501 | 529 | 959 | 965 | |
| 2019 | 1,032 | 1,027 | 1,093 | 1,513 | 952 | 1,596 | 1,538 | 985 | 877 | 1,367 | 896 | 870 |
| 2020 | 865 | 986 | 1,208 | 952 | 889 | 1,001 | 1,164 | 1,062 | 1,014 | 1,593 | 1,058 | 1,071 |
| 2021 | 1,067 | 531 | 1,061 | 2,208 | 1,043 | 1,059 | 1,604 | 1,263 | 1,063 | 1,059 | 532 | 524 |
| 2022 | -- | -- | -- | -- | -- | -- | -- | -- | -- | -- | -- | -- |
| 2023 | -- | -- | -- | -- | -- | -- | -- | -- | -- | -- | -- | -- |
| 2024 | -- | |||||||||||
| - = No Data Reported; -- = Not Applicable; NA = Not Available; W = Withheld to avoid disclosure of individual company data. |
| Release Date: 3/29/2024 |
| Next Release Date: 4/30/2024 |