|
Download Data (XLS File) |
|
||||||||
|
||||||||
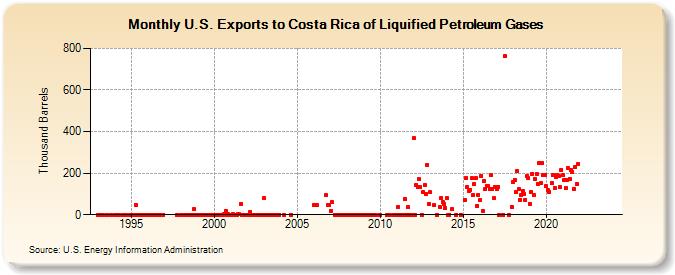
| U.S. Exports to Costa Rica of Liquified Petroleum Gases (Thousand Barrels) | ||||||||
| Year | Jan | Feb | Mar | Apr | May | Jun | Jul | Aug | Sep | Oct | Nov | Dec |
|---|---|---|---|---|---|---|---|---|---|---|---|---|
| 1993 | 0 | 0 | 0 | 1 | 0 | |||||||
| 1994 | 0 | 0 | 0 | 0 | 0 | 0 | 0 | |||||
| 1995 | 0 | 0 | 0 | 48 | 0 | 0 | 0 | 0 | 0 | 0 | 0 | 0 |
| 1996 | 0 | 0 | 0 | 0 | 0 | 0 | 1 | 0 | 0 | 0 | 0 | 0 |
| 1997 | 0 | |||||||||||
| 1998 | 0 | 0 | 0 | 0 | 0 | 0 | 0 | 0 | 0 | 26 | 0 | 0 |
| 1999 | 0 | 0 | 0 | 0 | 0 | 0 | 0 | 0 | 0 | 0 | 0 | 0 |
| 2000 | 0 | 0 | 1 | 1 | 1 | 1 | 0 | 2 | 19 | 1 | 2 | 1 |
| 2001 | 0 | 2 | 1 | 1 | 1 | 2 | 2 | 51 | 1 | 1 | 1 | 1 |
| 2002 | 0 | 1 | 14 | 1 | 1 | 1 | 0 | 1 | 1 | 0 | 0 | 0 |
| 2003 | 78 | 0 | 0 | 0 | 0 | 0 | 0 | 0 | 0 | 0 | 0 | 0 |
| 2004 | 0 | 0 | ||||||||||
| 2006 | 46 | 47 | 46 | 94 | 46 | 46 | ||||||
| 2007 | 20 | 59 | 0 | 0 | 1 | 0 | 0 | 1 | ||||
| 2008 | 1 | 0 | 1 | 0 | 0 | 1 | 0 | 0 | 0 | 0 | ||
| 2009 | 1 | 0 | 0 | 0 | 0 | 0 | ||||||
| 2010 | 0 | 1 | 0 | 1 | 0 | 0 | ||||||
| 2011 | 0 | 37 | 0 | 0 | 0 | 77 | 0 | 36 | 0 | 0 | 0 | |
| 2012 | 367 | 0 | 142 | 133 | 173 | 132 | 0 | 108 | 144 | 100 | 240 | 53 |
| 2013 | 108 | 45 | 0 | 37 | 80 | 62 | 51 | 33 | ||||
| 2014 | 78 | 0 | 0 | 26 | 0 | 0 | ||||||
| 2015 | 73 | 176 | 133 | 114 | 121 | 176 | 94 | 147 | 175 | 44 | 96 | |
| 2016 | 70 | 186 | 20 | 160 | 123 | 139 | 136 | 126 | 189 | 124 | 78 | 135 |
| 2017 | 123 | 135 | 0 | 0 | 762 | 0 | 39 | |||||
| 2018 | 158 | 169 | 109 | 211 | 122 | 73 | 94 | 114 | 102 | 72 | 185 | 176 |
| 2019 | 53 | 109 | 198 | 96 | 173 | 198 | 149 | 247 | 152 | 248 | 192 | 193 |
| 2020 | 137 | 118 | 109 | 151 | 191 | 130 | 180 | 189 | 187 | 131 | 216 | |
| 2021 | 191 | 168 | 129 | 166 | 223 | 173 | 216 | 206 | 125 | 229 | 148 | 246 |
| 2022 | -- | -- | -- | -- | -- | -- | -- | -- | -- | -- | -- | -- |
| 2023 | -- | -- | -- | -- | -- | -- | -- | -- | -- | -- | -- | -- |
| 2024 | -- | |||||||||||
| - = No Data Reported; -- = Not Applicable; NA = Not Available; W = Withheld to avoid disclosure of individual company data. |
| Release Date: 3/29/2024 |
| Next Release Date: 4/30/2024 |