|
Download Data (XLS File) |
|
||||||||
|
||||||||
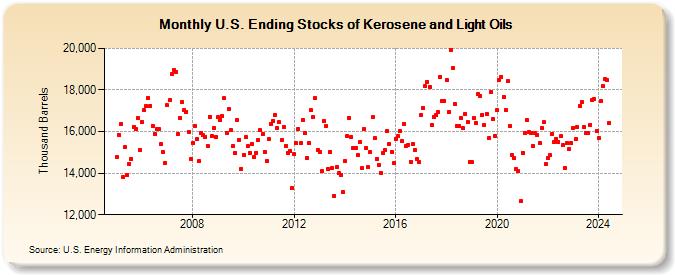
| U.S. Ending Stocks of Kerosene and Light Oils (Thousand Barrels) | ||||||||
| Year | Jan | Feb | Mar | Apr | May | Jun | Jul | Aug | Sep | Oct | Nov | Dec |
|---|---|---|---|---|---|---|---|---|---|---|---|---|
| 2005 | 14,752 | 15,823 | 16,351 | 13,815 | 15,249 | 13,916 | 14,459 | 14,689 | 16,234 | 16,137 | 16,641 | 15,103 |
| 2006 | 16,452 | 17,021 | 17,222 | 17,622 | 17,233 | 16,267 | 15,895 | 16,136 | 16,107 | 15,389 | 14,998 | 14,504 |
| 2007 | 17,262 | 17,497 | 18,767 | 18,979 | 18,882 | 15,865 | 16,651 | 17,417 | 17,019 | 16,954 | 15,985 | 14,666 |
| 2008 | 15,461 | 16,285 | 15,636 | 14,571 | 15,941 | 15,820 | 15,757 | 15,314 | 16,713 | 15,808 | 16,179 | 15,740 |
| 2009 | 16,684 | 16,563 | 16,745 | 17,600 | 15,952 | 17,091 | 16,062 | 15,301 | 14,957 | 16,561 | 15,598 | 14,218 |
| 2010 | 14,896 | 15,735 | 15,293 | 14,991 | 15,401 | 14,765 | 14,970 | 15,589 | 16,056 | 15,872 | 15,017 | 14,574 |
| 2011 | 15,631 | 16,367 | 16,522 | 16,798 | 16,168 | 16,444 | 15,605 | 16,213 | 15,321 | 14,974 | 15,044 | 13,274 |
| 2012 | 14,905 | 15,433 | 16,115 | 15,447 | 16,560 | 15,936 | 14,735 | 15,451 | 17,019 | 16,679 | 17,595 | 15,116 |
| 2013 | 14,993 | 14,097 | 16,503 | 16,271 | 14,187 | 15,035 | 14,250 | 12,922 | 14,284 | 13,985 | 13,897 | 13,082 |
| 2014 | 14,580 | 15,778 | 16,659 | 15,744 | 15,190 | 15,193 | 14,863 | 15,507 | 14,225 | 16,114 | 15,197 | 14,281 |
| 2015 | 15,011 | 16,680 | 15,666 | 14,697 | 14,399 | 14,008 | 14,991 | 15,100 | 16,032 | 15,417 | 15,040 | 14,486 |
| 2016 | 15,657 | 15,774 | 16,021 | 15,526 | 16,379 | 15,319 | 15,361 | 14,556 | 15,401 | 15,116 | 14,681 | 14,523 |
| 2017 | 16,804 | 17,129 | 18,177 | 18,386 | 18,159 | 16,310 | 16,715 | 16,818 | 16,934 | 18,643 | 17,465 | 17,474 |
| 2018 | 18,476 | 16,933 | 19,943 | 19,076 | 17,326 | 16,291 | 16,272 | 16,642 | 16,149 | 16,840 | 16,458 | 14,537 |
| 2019 | 14,521 | 16,654 | 16,423 | 17,811 | 17,718 | 16,796 | 16,319 | 16,840 | 15,676 | 17,902 | 16,588 | 15,808 |
| 2020 | 17,036 | 18,498 | 18,642 | 17,671 | 17,026 | 18,421 | 16,288 | 14,878 | 14,710 | 14,198 | 14,097 | 12,636 |
| 2021 | 14,982 | 15,920 | 16,562 | 15,963 | 15,934 | 15,304 | 15,943 | 15,840 | 15,446 | 16,182 | 16,438 | 14,424 |
| 2022 | 14,724 | 14,860 | 15,899 | 15,495 | 15,630 | 15,500 | 15,766 | 15,352 | 14,269 | 15,457 | 15,184 | 15,452 |
| 2023 | 16,021 | 15,536 | 16,069 | 17,043 | 17,241 | 16,039 | 15,748 | 15,807 | 16,180 | 17,278 | 17,303 | 16,022 |
| 2024 | 15,695 | |||||||||||
| - = No Data Reported; -- = Not Applicable; NA = Not Available; W = Withheld to avoid disclosure of individual company data. |
| Release Date: 3/29/2024 |
| Next Release Date: 4/30/2024 |