|
Download Data (XLS File) |
|
||||||||
|
||||||||
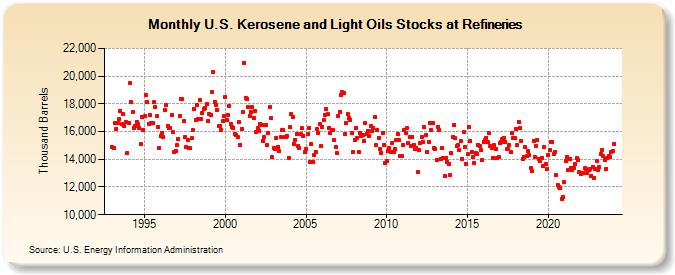
| U.S. Kerosene and Light Oils Stocks at Refineries (Thousand Barrels) | ||||||||
| Year | Jan | Feb | Mar | Apr | May | Jun | Jul | Aug | Sep | Oct | Nov | Dec |
|---|---|---|---|---|---|---|---|---|---|---|---|---|
| 1993 | 14,911 | 14,804 | 16,586 | 16,206 | 16,646 | 16,880 | 17,476 | 16,531 | 17,278 | 16,384 | 16,705 | 14,453 |
| 1994 | 16,638 | 19,513 | 18,110 | 17,383 | 16,243 | 16,384 | 16,702 | 16,555 | 16,238 | 15,122 | 17,051 | 16,136 |
| 1995 | 17,101 | 18,616 | 18,138 | 16,552 | 17,193 | 16,624 | 16,636 | 18,142 | 17,773 | 17,093 | 16,320 | 14,831 |
| 1996 | 15,682 | 15,918 | 15,613 | 17,577 | 17,903 | 16,400 | 16,245 | 16,248 | 17,228 | 15,934 | 14,518 | 14,606 |
| 1997 | 15,009 | 15,443 | 17,136 | 18,381 | 18,335 | 16,750 | 15,609 | 14,909 | 15,396 | 14,825 | 14,787 | 15,511 |
| 1998 | 16,086 | 17,613 | 16,837 | 17,924 | 16,880 | 18,312 | 16,889 | 17,370 | 17,592 | 17,724 | 17,976 | 16,770 |
| 1999 | 17,285 | 17,173 | 18,828 | 20,285 | 18,150 | 17,938 | 17,562 | 16,386 | 16,401 | 16,118 | 16,786 | 17,098 |
| 2000 | 18,501 | 16,860 | 17,196 | 17,830 | 16,571 | 16,322 | 16,260 | 15,831 | 15,758 | 15,585 | 16,672 | 15,049 |
| 2001 | 16,204 | 17,437 | 20,972 | 18,456 | 18,377 | 17,793 | 17,111 | 17,444 | 17,752 | 16,969 | 17,489 | 15,974 |
| 2002 | 16,235 | 16,044 | 16,573 | 16,471 | 15,354 | 15,605 | 16,459 | 15,028 | 15,914 | 17,760 | 17,000 | 14,133 |
| 2003 | 14,793 | 14,758 | 15,554 | 14,872 | 14,578 | 15,574 | 16,100 | 16,084 | 15,571 | 15,588 | 15,659 | 14,115 |
| 2004 | 16,298 | 17,243 | 17,017 | 15,130 | 15,418 | 15,848 | 14,982 | 14,823 | 15,832 | 16,235 | 15,700 | 14,491 |
| 2005 | 14,735 | 15,813 | 16,246 | 13,810 | 15,107 | 13,823 | 14,336 | 14,527 | 16,202 | 15,912 | 16,522 | 14,961 |
| 2006 | 16,321 | 16,803 | 17,216 | 17,616 | 17,232 | 16,267 | 15,895 | 16,136 | 16,107 | 15,356 | 14,915 | 14,421 |
| 2007 | 17,134 | 17,413 | 18,646 | 18,842 | 18,808 | 15,833 | 16,600 | 17,279 | 16,976 | 16,843 | 15,874 | 14,560 |
| 2008 | 15,422 | 16,285 | 15,521 | 14,501 | 15,871 | 15,702 | 15,728 | 15,288 | 16,637 | 15,808 | 16,041 | 15,709 |
| 2009 | 16,419 | 16,054 | 16,277 | 17,025 | 15,004 | 16,107 | 15,542 | 14,721 | 14,435 | 15,884 | 15,043 | 13,699 |
| 2010 | 13,906 | 14,599 | 14,800 | 14,553 | 15,204 | 14,553 | 14,734 | 15,389 | 15,829 | 15,393 | 14,226 | 14,243 |
| 2011 | 15,037 | 16,108 | 15,908 | 16,237 | 15,160 | 15,593 | 14,938 | 15,635 | 15,050 | 14,709 | 14,837 | 13,056 |
| 2012 | 14,671 | 15,210 | 15,604 | 15,231 | 16,335 | 15,745 | 14,507 | 15,253 | 16,617 | 16,078 | 16,629 | 14,788 |
| 2013 | 14,767 | 13,951 | 16,347 | 16,112 | 14,024 | 14,844 | 14,106 | 12,760 | 14,114 | 13,804 | 13,683 | 12,855 |
| 2014 | 14,419 | 15,604 | 16,490 | 15,545 | 14,982 | 15,025 | 14,682 | 15,325 | 14,055 | 15,933 | 14,876 | 13,670 |
| 2015 | 14,358 | 16,357 | 15,319 | 14,547 | 14,176 | 13,753 | 14,426 | 14,403 | 15,052 | 14,939 | 14,674 | 13,982 |
| 2016 | 15,277 | 15,406 | 15,560 | 15,224 | 15,886 | 14,938 | 14,814 | 14,106 | 15,000 | 14,730 | 14,090 | 14,156 |
| 2017 | 15,142 | 15,220 | 15,427 | 15,540 | 15,272 | 14,756 | 14,747 | 15,010 | 14,529 | 15,877 | 15,538 | 15,535 |
| 2018 | 16,212 | 14,996 | 16,704 | 16,277 | 15,304 | 14,011 | 14,190 | 14,872 | 14,252 | 14,592 | 14,300 | 13,385 |
| 2019 | 13,153 | 15,291 | 14,167 | 14,967 | 15,397 | 14,051 | 13,873 | 14,090 | 13,497 | 14,900 | 13,657 | 13,301 |
| 2020 | 14,276 | 14,682 | 15,267 | 15,213 | 14,377 | 14,557 | 12,839 | 12,139 | 12,032 | 11,893 | 11,125 | 11,308 |
| 2021 | 12,330 | 13,907 | 14,200 | 13,241 | 13,994 | 13,381 | 13,212 | 13,343 | 13,637 | 14,056 | 13,931 | 13,099 |
| 2022 | 12,902 | 13,010 | 13,010 | 13,340 | 13,290 | 12,990 | 13,223 | 13,297 | 12,797 | 13,430 | 12,675 | 13,305 |
| 2023 | 13,847 | 13,239 | 13,422 | 14,361 | 14,664 | 14,210 | 13,917 | 13,332 | 14,056 | 14,223 | 14,182 | 14,498 |
| 2024 | 14,594 | |||||||||||
| - = No Data Reported; -- = Not Applicable; NA = Not Available; W = Withheld to avoid disclosure of individual company data. |
| Release Date: 3/29/2024 |
| Next Release Date: 4/30/2024 |