|
Download Data (XLS File) |
|
||||||||
|
||||||||
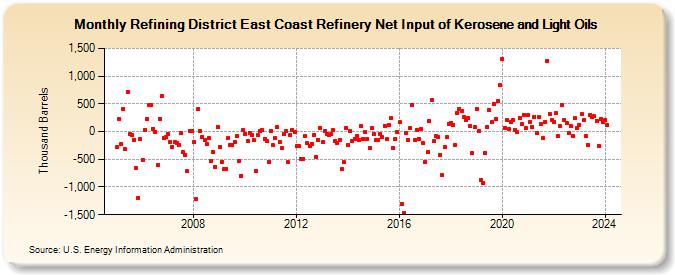
| Refining District East Coast Refinery Net Input of Kerosene and Light Oils (Thousand Barrels) | ||||||||
| Year | Jan | Feb | Mar | Apr | May | Jun | Jul | Aug | Sep | Oct | Nov | Dec |
|---|---|---|---|---|---|---|---|---|---|---|---|---|
| 2005 | -286 | 227 | -233 | 412 | -315 | 706 | -46 | -70 | -156 | -661 | -1,191 | -139 |
| 2006 | -508 | 30 | 221 | 471 | 471 | 50 | -9 | -604 | 233 | 642 | -119 | -105 |
| 2007 | -51 | -196 | -273 | -185 | -214 | -242 | -28 | -377 | -419 | -718 | 8 | 2 |
| 2008 | -196 | -1,223 | 407 | 10 | -93 | -158 | -222 | -117 | -535 | -377 | -634 | 86 |
| 2009 | -277 | -543 | -676 | -668 | -119 | -237 | -239 | -195 | -76 | -528 | -795 | 24 |
| 2010 | -39 | -173 | -26 | -65 | -159 | -715 | -68 | 4 | 24 | -128 | -174 | -550 |
| 2011 | 11 | -250 | -121 | 75 | -186 | -301 | -52 | 8 | -557 | -67 | 32 | -11 |
| 2012 | -263 | -268 | -487 | -490 | -82 | -207 | -268 | -219 | -57 | -452 | -147 | 73 |
| 2013 | -197 | 8 | -43 | -58 | -51 | 23 | -166 | -215 | -148 | -677 | -551 | 66 |
| 2014 | -248 | 13 | -171 | -129 | -73 | -145 | 95 | -126 | -6 | -133 | -299 | 56 |
| 2015 | -43 | -153 | -144 | -41 | -107 | 106 | -136 | 110 | 239 | -304 | -134 | -13 |
| 2016 | 164 | -1,304 | -1,470 | -21 | -151 | 65 | 475 | -155 | 34 | -130 | 48 | -214 |
| 2017 | -551 | -377 | 189 | 564 | -175 | -85 | -107 | -422 | -789 | -277 | -101 | 144 |
| 2018 | 160 | 127 | -234 | 331 | 409 | 368 | 261 | 211 | 243 | 94 | -394 | 74 |
| 2019 | 405 | 12 | -872 | -926 | -391 | 79 | 383 | 171 | 498 | 220 | 547 | 833 |
| 2020 | 1,317 | 69 | 208 | 43 | 177 | 201 | 32 | -16 | 242 | 131 | 301 | 62 |
| 2021 | 295 | 181 | 89 | 267 | -20 | 255 | 141 | -121 | 178 | 1,277 | 314 | 211 |
| 2022 | 177 | 328 | -87 | 95 | 472 | 209 | 152 | -19 | 93 | -85 | 236 | 69 |
| 2023 | 124 | 318 | 200 | -72 | -242 | 303 | 271 | 274 | 195 | -253 | 226 | 177 |
| 2024 | 208 | |||||||||||
| - = No Data Reported; -- = Not Applicable; NA = Not Available; W = Withheld to avoid disclosure of individual company data. |
| Release Date: 3/29/2024 |
| Next Release Date: 4/30/2024 |