|
Download Data (XLS File) |
|
||||||||
|
||||||||
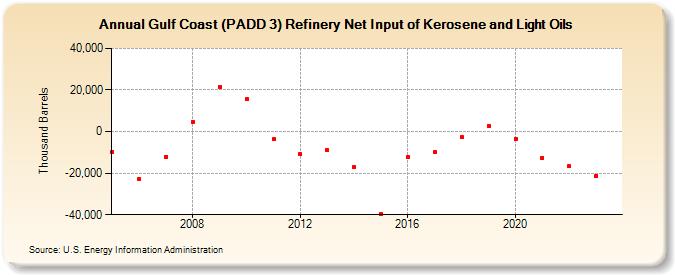
| Gulf Coast (PADD 3) Refinery Net Input of Kerosene and Light Oils (Thousand Barrels) | ||||||||
| Decade | Year-0 | Year-1 | Year-2 | Year-3 | Year-4 | Year-5 | Year-6 | Year-7 | Year-8 | Year-9 |
|---|---|---|---|---|---|---|---|---|---|---|
| 2000's | -9,891 | -22,684 | -12,046 | 4,625 | 21,597 | |||||
| 2010's | 15,418 | -3,588 | -10,848 | -8,983 | -17,046 | -39,735 | -12,006 | -9,967 | -2,738 | 2,685 |
| 2020's | -3,347 | -12,556 | -16,779 | -24,565 |
| - = No Data Reported; -- = Not Applicable; NA = Not Available; W = Withheld to avoid disclosure of individual company data. |
| Release Date: 8/30/2024 |
| Next Release Date: 8/29/2025 |