|
Download Data (XLS File) |
|
||||||||
|
||||||||
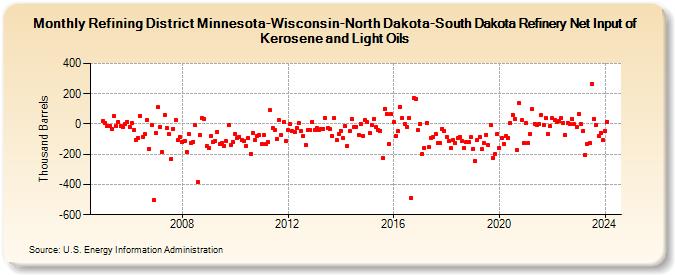
| Refining District Minnesota-Wisconsin-North Dakota-South Dakota Refinery Net Input of Kerosene and Light Oils (Thousand Barrels) | ||||||||
| Year | Jan | Feb | Mar | Apr | May | Jun | Jul | Aug | Sep | Oct | Nov | Dec |
|---|---|---|---|---|---|---|---|---|---|---|---|---|
| 2005 | 20 | 6 | -12 | -11 | -33 | 51 | -15 | 14 | -15 | -22 | 3 | 16 |
| 2006 | -17 | 7 | -37 | -104 | -90 | 56 | -84 | -69 | 29 | -163 | -4 | -502 |
| 2007 | -59 | 110 | -17 | -186 | 62 | -26 | -69 | -230 | -33 | 25 | -106 | -85 |
| 2008 | -122 | -111 | -183 | -69 | -128 | -116 | -10 | -385 | -75 | 41 | 33 | -146 |
| 2009 | -160 | -78 | -122 | -111 | -52 | -135 | -125 | -144 | -112 | -10 | -140 | -119 |
| 2010 | -64 | -90 | -83 | -108 | -114 | -143 | -92 | -198 | -59 | -107 | -79 | -75 |
| 2011 | -134 | -72 | -133 | -119 | 90 | -27 | -37 | -97 | 25 | -74 | 13 | -112 |
| 2012 | -40 | -3 | -48 | -50 | -26 | 6 | -47 | -79 | -138 | -38 | -40 | 15 |
| 2013 | -43 | -28 | -39 | -32 | -31 | 40 | -29 | -34 | -79 | 38 | -109 | -65 |
| 2014 | -44 | -96 | -16 | -143 | -45 | 34 | -20 | -19 | -72 | 2 | -78 | 26 |
| 2015 | 11 | -61 | -5 | 33 | -23 | -39 | -44 | -223 | 101 | 66 | -134 | 64 |
| 2016 | 11 | -80 | -48 | 114 | 39 | 1 | -19 | 40 | -488 | 173 | 164 | -43 |
| 2017 | 1 | -198 | -156 | 9 | -154 | -91 | -88 | -66 | -128 | -129 | -30 | -46 |
| 2018 | -83 | -115 | -159 | -108 | -127 | -94 | -83 | -113 | -158 | -117 | -117 | -88 |
| 2019 | -163 | -248 | -108 | -84 | -168 | -124 | -71 | -142 | -6 | -223 | -199 | -67 |
| 2020 | -158 | -96 | -130 | -80 | -90 | 7 | 61 | 34 | -175 | 138 | 24 | -124 |
| 2021 | 6 | -126 | -64 | 99 | 3 | -4 | 0 | 60 | -6 | 41 | -66 | -16 |
| 2022 | 37 | 23 | 12 | 20 | 39 | 7 | -74 | 7 | -3 | 35 | -3 | -20 |
| 2023 | 66 | 0 | -48 | -205 | -132 | -127 | 267 | 34 | -4 | -77 | -59 | -108 |
| 2024 | -48 | 15 | -111 | -554 | 201 | 97 | ||||||
| - = No Data Reported; -- = Not Applicable; NA = Not Available; W = Withheld to avoid disclosure of individual company data. |
| Release Date: 8/30/2024 |
| Next Release Date: 9/30/2024 |