|
Download Data (XLS File) |
|
||||||||
|
||||||||
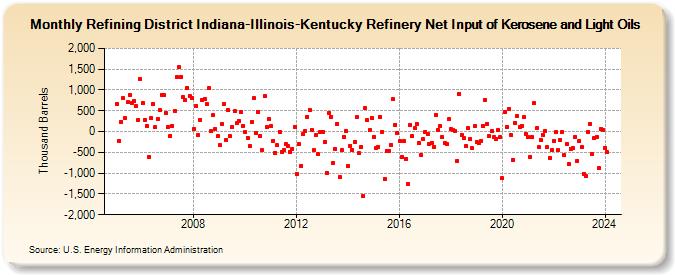
| Refining District Indiana-Illinois-Kentucky Refinery Net Input of Kerosene and Light Oils (Thousand Barrels) | ||||||||
| Year | Jan | Feb | Mar | Apr | May | Jun | Jul | Aug | Sep | Oct | Nov | Dec |
|---|---|---|---|---|---|---|---|---|---|---|---|---|
| 2005 | 663 | -227 | 241 | 804 | 318 | 702 | 891 | 695 | 723 | 604 | 282 | 1,268 |
| 2006 | 685 | 283 | 135 | -601 | 314 | 661 | 98 | 302 | 513 | 886 | 875 | 445 |
| 2007 | 110 | -95 | 139 | 493 | 1,304 | 1,545 | 1,319 | 819 | 751 | 1,054 | 854 | 810 |
| 2008 | 66 | 611 | -81 | 284 | 751 | 786 | 664 | 1,036 | 4 | 390 | 67 | -110 |
| 2009 | -332 | 182 | 655 | -202 | 520 | -118 | 116 | 494 | 203 | 260 | 460 | 145 |
| 2010 | -18 | -144 | -345 | 226 | 797 | -36 | 481 | -112 | -451 | 852 | 98 | 301 |
| 2011 | 131 | -216 | -505 | -335 | -1 | -483 | -452 | -300 | -356 | -484 | -414 | 120 |
| 2012 | -1,017 | -295 | -821 | -62 | 3 | 361 | 516 | 46 | -454 | -78 | -541 | -13 |
| 2013 | 1 | -252 | -993 | 456 | 362 | -747 | -424 | 190 | -1,099 | -448 | -122 | 11 |
| 2014 | -819 | -340 | -444 | -240 | 343 | -515 | -364 | -1,553 | 558 | 276 | 33 | 326 |
| 2015 | -122 | -402 | -364 | 360 | -2 | -1,145 | -457 | -470 | -317 | 771 | 167 | -28 |
| 2016 | -239 | -608 | -234 | -650 | -1,262 | 162 | -111 | 74 | 181 | -278 | -557 | -186 |
| 2017 | 1 | -54 | -299 | -267 | -362 | 405 | 41 | 138 | -134 | -282 | -295 | 294 |
| 2018 | 57 | 30 | 18 | -702 | 905 | -72 | -148 | -351 | 75 | -174 | -405 | 127 |
| 2019 | -242 | -281 | -219 | 130 | 762 | 182 | -110 | 17 | -129 | -168 | 33 | -134 |
| 2020 | -1,128 | 478 | 117 | 537 | -87 | -673 | 216 | 368 | 110 | 143 | 345 | -48 |
| 2021 | -143 | -600 | -138 | 675 | 77 | -381 | -201 | -71 | 9 | -380 | -625 | -448 |
| 2022 | -222 | -20 | -451 | -206 | -20 | -573 | -291 | -790 | -409 | -406 | -131 | -702 |
| 2023 | -231 | -373 | -1,011 | -1,060 | 1 | 183 | -546 | -144 | -126 | -886 | 68 | 34 |
| 2024 | -390 | |||||||||||
| - = No Data Reported; -- = Not Applicable; NA = Not Available; W = Withheld to avoid disclosure of individual company data. |
| Release Date: 3/29/2024 |
| Next Release Date: 4/30/2024 |