|
Download Data (XLS File) |
|
||||||||
|
||||||||
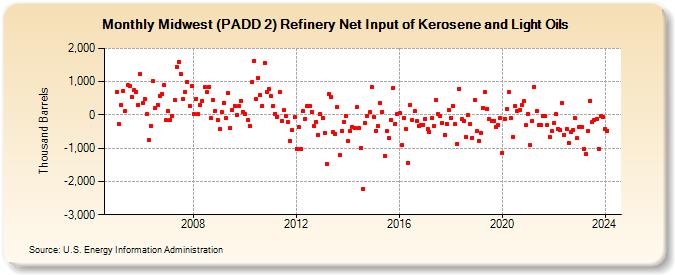
| Midwest (PADD 2) Refinery Net Input of Kerosene and Light Oils (Thousand Barrels) | ||||||||
| Year | Jan | Feb | Mar | Apr | May | Jun | Jul | Aug | Sep | Oct | Nov | Dec |
|---|---|---|---|---|---|---|---|---|---|---|---|---|
| 2005 | 699 | -283 | 300 | 730 | 117 | 885 | 876 | 553 | 735 | 696 | 309 | 1,222 |
| 2006 | 350 | 472 | 17 | -747 | -323 | 1,010 | 195 | 312 | 569 | 635 | 891 | -166 |
| 2007 | 108 | -146 | -27 | 446 | 1,448 | 1,604 | 1,218 | 464 | 696 | 991 | 271 | 878 |
| 2008 | 22 | 487 | 20 | 311 | 418 | 838 | 695 | 846 | -101 | 457 | 128 | -145 |
| 2009 | -435 | 84 | 366 | -79 | 652 | -385 | 161 | 280 | -2 | 259 | 427 | 99 |
| 2010 | 25 | -158 | -338 | 976 | 1,626 | 468 | 1,110 | 589 | 283 | 1,571 | 700 | 769 |
| 2011 | 568 | 269 | 40 | -51 | 675 | -177 | 139 | -30 | -209 | -782 | -463 | -72 |
| 2012 | -1,012 | -360 | -1,032 | 107 | -120 | 277 | 272 | 97 | -338 | -200 | -596 | 24 |
| 2013 | -95 | -541 | -1,468 | 622 | 538 | -514 | -569 | 236 | -1,205 | -469 | -210 | -28 |
| 2014 | -796 | -484 | -354 | -391 | 229 | -395 | -1,003 | -2,212 | -231 | -40 | 73 | 833 |
| 2015 | -64 | -481 | -334 | 354 | 88 | -1,227 | -486 | -707 | -148 | 814 | -261 | 41 |
| 2016 | 48 | -903 | -96 | -429 | -1,432 | 306 | -146 | 110 | -196 | -322 | -290 | -288 |
| 2017 | -112 | -419 | -503 | -95 | -329 | 437 | 20 | -32 | -240 | -604 | -266 | 155 |
| 2018 | -89 | 275 | -269 | -862 | 781 | -133 | -187 | -657 | -3 | -283 | -679 | 447 |
| 2019 | -496 | -777 | -539 | 205 | 685 | 182 | -136 | -194 | -171 | -365 | -318 | -95 |
| 2020 | -1,135 | -115 | 183 | 676 | -94 | -658 | 261 | 111 | 160 | 302 | 410 | -318 |
| 2021 | 39 | -903 | -187 | 847 | 114 | -317 | -292 | -26 | -39 | -304 | -661 | -484 |
| 2022 | -242 | 25 | -430 | -463 | 363 | -589 | -409 | -830 | -508 | -461 | -101 | -703 |
| 2023 | -358 | -357 | -1,030 | -1,182 | -473 | 423 | -226 | -158 | -118 | -1,013 | -26 | -55 |
| 2024 | -424 | |||||||||||
| - = No Data Reported; -- = Not Applicable; NA = Not Available; W = Withheld to avoid disclosure of individual company data. |
| Release Date: 3/29/2024 |
| Next Release Date: 4/30/2024 |