|
Download Data (XLS File) |
|
||||||||
|
||||||||
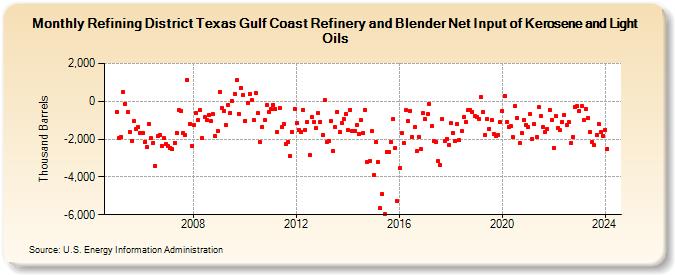
| Refining District Texas Gulf Coast Refinery and Blender Net Input of Kerosene and Light Oils (Thousand Barrels) | ||||||||
| Year | Jan | Feb | Mar | Apr | May | Jun | Jul | Aug | Sep | Oct | Nov | Dec |
|---|---|---|---|---|---|---|---|---|---|---|---|---|
| 2005 | -559 | -1,958 | -1,870 | 499 | -138 | -576 | -1,599 | -2,083 | -1,064 | -1,482 | -1,353 | -1,691 |
| 2006 | -1,695 | -2,141 | -2,429 | -1,197 | -1,959 | -2,203 | -3,411 | -1,837 | -1,779 | -2,348 | -1,963 | -2,236 |
| 2007 | -2,354 | -2,468 | -2,547 | -2,196 | -1,659 | -482 | -502 | -1,679 | -1,806 | 1,144 | -1,202 | -2,354 |
| 2008 | -1,249 | -638 | -1,002 | -486 | -1,945 | -846 | -1,013 | -721 | -1,039 | -679 | -1,857 | -1,589 |
| 2009 | 497 | -344 | -494 | -1,263 | -188 | -603 | 13 | 410 | 1,107 | -664 | 729 | 351 |
| 2010 | -1,023 | -80 | 374 | 48 | -966 | 455 | -636 | -2,166 | -1,337 | -1,002 | -196 | -572 |
| 2011 | -409 | -170 | -417 | -1,612 | -343 | -1,373 | -1,177 | -2,238 | -2,133 | -2,898 | -1,612 | -400 |
| 2012 | -1,161 | -1,507 | -1,629 | -459 | -1,512 | -1,081 | -2,854 | -850 | -1,104 | -1,414 | -616 | -1,077 |
| 2013 | -1,786 | 54 | -2,150 | -2,080 | -1,047 | -2,633 | -1,374 | -541 | -1,624 | -1,151 | -951 | -669 |
| 2014 | -1,525 | -438 | -1,585 | -1,551 | -1,247 | -1,706 | -981 | -1,657 | -461 | -3,214 | -3,158 | -1,591 |
| 2015 | -3,907 | -2,161 | -3,209 | -5,659 | -4,898 | -5,966 | -2,676 | -2,675 | -2,149 | -951 | -2,470 | -5,297 |
| 2016 | -3,554 | -1,697 | -2,194 | -482 | -1,065 | -495 | -1,899 | -1,377 | -2,654 | -1,867 | -2,545 | -638 |
| 2017 | -955 | -687 | -153 | -1,293 | -2,124 | -2,151 | -3,182 | -3,394 | -926 | -2,120 | -1,969 | -2,294 |
| 2018 | -1,164 | -1,652 | -2,117 | -1,222 | -2,068 | -1,547 | -832 | -1,102 | -468 | -439 | -548 | -789 |
| 2019 | -808 | -915 | 231 | -579 | -1,776 | -915 | -1,449 | -987 | -1,723 | -1,831 | -1,765 | -1,102 |
| 2020 | -526 | 281 | -1,084 | -1,384 | -1,326 | -1,906 | -274 | -863 | -2,205 | -1,695 | -968 | -1,245 |
| 2021 | -1,370 | -686 | -2,006 | -1,214 | -1,909 | -327 | -793 | -1,385 | -1,609 | -1,462 | -444 | -1,016 |
| 2022 | -2,469 | -798 | -1,413 | -1,538 | -1,090 | -703 | -1,267 | -1,121 | -2,216 | -1,886 | -287 | -274 |
| 2023 | -504 | -263 | -1,016 | -402 | -870 | -1,629 | -2,154 | -2,338 | -1,781 | -1,218 | -1,639 | -1,819 |
| 2024 | -1,497 | |||||||||||
| - = No Data Reported; -- = Not Applicable; NA = Not Available; W = Withheld to avoid disclosure of individual company data. |
| Release Date: 3/29/2024 |
| Next Release Date: 4/30/2024 |