|
Download Data (XLS File) |
|
||||||||
|
||||||||
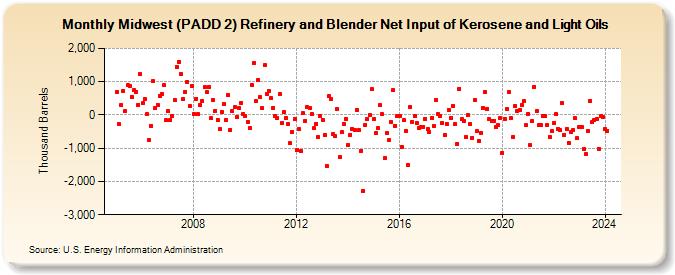
| Midwest (PADD 2) Refinery and Blender Net Input of Kerosene and Light Oils (Thousand Barrels) | ||||||||
| Year | Jan | Feb | Mar | Apr | May | Jun | Jul | Aug | Sep | Oct | Nov | Dec |
|---|---|---|---|---|---|---|---|---|---|---|---|---|
| 2005 | 699 | -283 | 300 | 730 | 117 | 885 | 876 | 553 | 735 | 696 | 309 | 1,222 |
| 2006 | 350 | 472 | 17 | -747 | -323 | 1,010 | 195 | 312 | 569 | 635 | 891 | -166 |
| 2007 | 108 | -146 | -27 | 446 | 1,448 | 1,604 | 1,218 | 464 | 696 | 991 | 271 | 878 |
| 2008 | 22 | 487 | 20 | 311 | 418 | 838 | 695 | 846 | -101 | 457 | 128 | -145 |
| 2009 | -435 | 84 | 320 | -149 | 594 | -440 | 106 | 226 | -62 | 202 | 369 | 38 |
| 2010 | -23 | -208 | -395 | 908 | 1,568 | 408 | 1,056 | 533 | 207 | 1,493 | 633 | 708 |
| 2011 | 499 | 216 | -21 | -105 | 615 | -244 | 80 | -83 | -273 | -853 | -521 | -128 |
| 2012 | -1,065 | -416 | -1,086 | 50 | -174 | 224 | 211 | 40 | -405 | -265 | -661 | -31 |
| 2013 | -150 | -605 | -1,535 | 561 | 478 | -576 | -635 | 167 | -1,266 | -527 | -269 | -111 |
| 2014 | -907 | -597 | -416 | -465 | 162 | -466 | -1,074 | -2,287 | -291 | -117 | -1 | 767 |
| 2015 | -128 | -537 | -402 | 286 | 20 | -1,302 | -546 | -765 | -218 | 739 | -322 | -27 |
| 2016 | -19 | -961 | -155 | -482 | -1,498 | 241 | -210 | -35 | -239 | -389 | -349 | -354 |
| 2017 | -112 | -419 | -503 | -95 | -329 | 437 | 20 | -32 | -240 | -604 | -266 | 155 |
| 2018 | -89 | 275 | -269 | -862 | 781 | -133 | -187 | -657 | -3 | -283 | -679 | 447 |
| 2019 | -496 | -777 | -539 | 205 | 685 | 182 | -136 | -194 | -171 | -365 | -318 | -95 |
| 2020 | -1,135 | -115 | 183 | 676 | -94 | -658 | 261 | 111 | 160 | 302 | 410 | -318 |
| 2021 | 39 | -903 | -187 | 847 | 114 | -317 | -292 | -26 | -39 | -304 | -661 | -484 |
| 2022 | -242 | 25 | -430 | -463 | 363 | -589 | -409 | -830 | -508 | -461 | -101 | -703 |
| 2023 | -358 | -357 | -1,030 | -1,182 | -473 | 423 | -226 | -158 | -118 | -1,013 | -26 | -55 |
| 2024 | -424 | |||||||||||
| - = No Data Reported; -- = Not Applicable; NA = Not Available; W = Withheld to avoid disclosure of individual company data. |
| Release Date: 3/29/2024 |
| Next Release Date: 4/30/2024 |