|
Download Data (XLS File) |
|
||||||||
|
||||||||
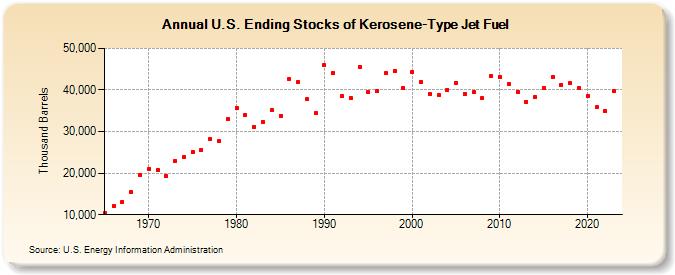
| U.S. Ending Stocks of Kerosene-Type Jet Fuel (Thousand Barrels) | ||||||||
| Decade | Year-0 | Year-1 | Year-2 | Year-3 | Year-4 | Year-5 | Year-6 | Year-7 | Year-8 | Year-9 |
|---|---|---|---|---|---|---|---|---|---|---|
| 1960's | 10,361 | 12,139 | 13,174 | 15,373 | 19,517 | |||||
| 1970's | 20,989 | 20,747 | 19,346 | 22,945 | 23,906 | 25,158 | 25,590 | 28,263 | 27,707 | 32,921 |
| 1980's | 35,723 | 34,011 | 31,180 | 32,346 | 35,118 | 33,825 | 42,677 | 41,973 | 37,723 | 34,471 |
| 1990's | 45,925 | 44,068 | 38,642 | 38,044 | 45,630 | 39,449 | 39,779 | 44,009 | 44,660 | 40,447 |
| 2000's | 44,409 | 41,871 | 39,123 | 38,767 | 40,086 | 41,741 | 39,129 | 39,458 | 37,969 | 43,397 |
| 2010's | 43,218 | 41,483 | 39,620 | 37,183 | 38,274 | 40,390 | 43,010 | 41,304 | 41,585 | 40,467 |
| 2020's | 38,627 | 35,798 | 35,039 | 39,776 |
| - = No Data Reported; -- = Not Applicable; NA = Not Available; W = Withheld to avoid disclosure of individual company data. |
| Release Date: 8/30/2024 |
| Next Release Date: 8/29/2025 |