|
Download Data (XLS File) |
|
||||||||
|
||||||||
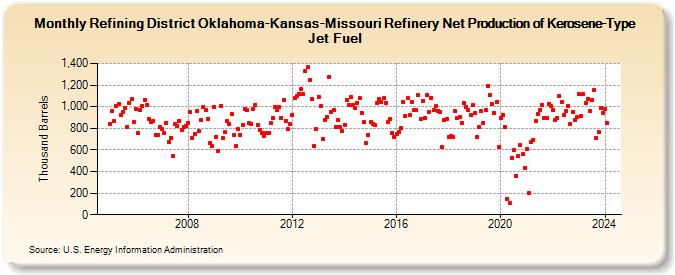
| Refining District Oklahoma-Kansas-Missouri Refinery Net Production of Kerosene-Type Jet Fuel (Thousand Barrels) | ||||||||
| Year | Jan | Feb | Mar | Apr | May | Jun | Jul | Aug | Sep | Oct | Nov | Dec |
|---|---|---|---|---|---|---|---|---|---|---|---|---|
| 2005 | 844 | 957 | 867 | 1,010 | 1,026 | 919 | 949 | 986 | 815 | 1,032 | 1,073 | 855 |
| 2006 | 976 | 752 | 968 | 1,005 | 1,061 | 1,016 | 883 | 860 | 872 | 735 | 739 | 809 |
| 2007 | 795 | 756 | 853 | 675 | 714 | 539 | 836 | 817 | 870 | 787 | 815 | 819 |
| 2008 | 852 | 947 | 711 | 747 | 957 | 773 | 876 | 997 | 967 | 887 | 661 | 635 |
| 2009 | 998 | 723 | 594 | 1,007 | 708 | 762 | 864 | 837 | 935 | 736 | 635 | 791 |
| 2010 | 736 | 827 | 977 | 967 | 852 | 842 | 975 | 1,020 | 828 | 783 | 759 | 730 |
| 2011 | 753 | 759 | 848 | 898 | 993 | 970 | 997 | 896 | 1,061 | 868 | 789 | 841 |
| 2012 | 924 | 1,078 | 1,099 | 1,121 | 1,161 | 1,113 | 1,330 | 1,363 | 1,249 | 1,070 | 638 | 794 |
| 2013 | 1,090 | 1,004 | 703 | 881 | 901 | 1,273 | 950 | 970 | 811 | 877 | 814 | 775 |
| 2014 | 835 | 1,065 | 1,020 | 1,094 | 1,013 | 989 | 1,036 | 1,084 | 945 | 862 | 664 | 737 |
| 2015 | 858 | 837 | 829 | 1,031 | 1,073 | 1,039 | 1,077 | 1,035 | 857 | 882 | 759 | 721 |
| 2016 | 743 | 765 | 800 | 1,039 | 917 | 1,076 | 919 | 1,046 | 967 | 965 | 1,104 | 882 |
| 2017 | 1,054 | 898 | 1,108 | 951 | 1,085 | 965 | 1,002 | 963 | 955 | 625 | 877 | 886 |
| 2018 | 719 | 725 | 717 | 960 | 898 | 906 | 851 | 1,034 | 994 | 965 | 919 | 1,012 |
| 2019 | 937 | 715 | 810 | 956 | 848 | 971 | 1,196 | 1,110 | 1,022 | 941 | 1,043 | 629 |
| 2020 | 894 | 925 | 813 | 150 | 105 | 528 | 601 | 360 | 541 | 643 | 558 | 436 |
| 2021 | 604 | 199 | 672 | 695 | 866 | 934 | 972 | 1,012 | 891 | 892 | 1,029 | 1,004 |
| 2022 | 967 | 879 | 893 | 1,101 | 1,041 | 927 | 956 | 1,010 | 841 | 955 | 878 | 905 |
| 2023 | 1,115 | 916 | 1,115 | 1,030 | 1,073 | 956 | 1,062 | 1,154 | 708 | 770 | 986 | 943 |
| 2024 | 974 | |||||||||||
| - = No Data Reported; -- = Not Applicable; NA = Not Available; W = Withheld to avoid disclosure of individual company data. |
| Release Date: 3/29/2024 |
| Next Release Date: 4/30/2024 |