|
Download Data (XLS File) |
|
||||||||
|
||||||||
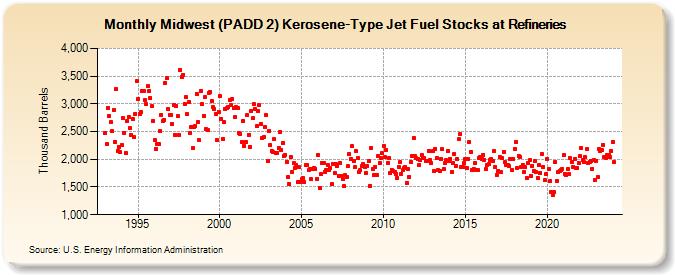
| Midwest (PADD 2) Kerosene-Type Jet Fuel Stocks at Refineries (Thousand Barrels) | ||||||||
| Year | Jan | Feb | Mar | Apr | May | Jun | Jul | Aug | Sep | Oct | Nov | Dec |
|---|---|---|---|---|---|---|---|---|---|---|---|---|
| 1993 | 2,471 | 2,271 | 2,919 | 2,779 | 2,664 | 2,501 | 2,889 | 2,312 | 3,271 | 2,156 | 2,218 | 2,127 |
| 1994 | 2,257 | 2,741 | 2,481 | 2,112 | 2,699 | 2,761 | 2,562 | 2,436 | 2,735 | 2,394 | 2,822 | 3,409 |
| 1995 | 3,084 | 2,818 | 2,855 | 3,240 | 3,224 | 3,074 | 2,993 | 3,315 | 3,227 | 3,101 | 2,954 | 2,697 |
| 1996 | 2,339 | 2,188 | 2,274 | 2,271 | 2,503 | 2,805 | 2,688 | 2,704 | 3,381 | 3,462 | 2,901 | 2,805 |
| 1997 | 2,807 | 2,635 | 2,983 | 2,445 | 2,964 | 2,773 | 2,441 | 3,610 | 3,492 | 3,527 | 2,999 | 3,117 |
| 1998 | 2,811 | 3,025 | 2,477 | 2,575 | 2,199 | 2,588 | 2,598 | 3,185 | 2,671 | 2,340 | 3,232 | 2,993 |
| 1999 | 2,788 | 3,129 | 2,543 | 2,528 | 3,198 | 3,213 | 3,049 | 2,937 | 2,910 | 2,817 | 2,344 | 2,848 |
| 2000 | 3,135 | 2,733 | 2,369 | 2,668 | 2,903 | 2,917 | 2,944 | 3,065 | 2,975 | 3,089 | 2,923 | 2,762 |
| 2001 | 2,942 | 2,932 | 2,475 | 2,463 | 2,320 | 2,698 | 2,242 | 2,319 | 2,793 | 2,446 | 2,228 | 2,873 |
| 2002 | 2,742 | 2,988 | 2,908 | 2,593 | 2,869 | 2,973 | 2,639 | 2,392 | 2,393 | 2,584 | 2,793 | 1,969 |
| 2003 | 2,512 | 2,249 | 2,154 | 2,131 | 2,358 | 2,107 | 2,110 | 2,200 | 2,490 | 2,165 | 2,291 | 2,055 |
| 2004 | 2,086 | 1,956 | 1,675 | 1,550 | 2,033 | 1,777 | 1,929 | 1,845 | 1,898 | 1,589 | 1,855 | 1,586 |
| 2005 | 1,642 | 1,658 | 1,589 | 1,892 | 1,892 | 1,799 | 1,823 | 1,636 | 1,833 | 1,851 | 1,831 | 1,645 |
| 2006 | 2,081 | 1,477 | 1,733 | 1,936 | 1,932 | 1,774 | 1,809 | 1,896 | 1,798 | 1,834 | 1,551 | 1,923 |
| 2007 | 1,756 | 1,909 | 1,887 | 1,695 | 1,932 | 1,703 | 1,641 | 1,513 | 1,711 | 1,685 | 1,878 | 2,091 |
| 2008 | 1,996 | 2,239 | 1,963 | 1,854 | 2,141 | 2,023 | 1,765 | 1,798 | 1,886 | 1,911 | 1,864 | 1,755 |
| 2009 | 1,875 | 1,968 | 1,523 | 2,206 | 1,816 | 1,717 | 1,867 | 1,709 | 2,060 | 1,936 | 2,022 | 2,108 |
| 2010 | 2,241 | 2,038 | 2,164 | 1,940 | 2,024 | 1,754 | 1,814 | 1,786 | 1,767 | 1,726 | 1,664 | 1,867 |
| 2011 | 1,943 | 1,736 | 1,798 | 1,840 | 1,852 | 1,570 | 1,821 | 1,682 | 1,952 | 2,051 | 2,392 | 2,053 |
| 2012 | 2,016 | 2,009 | 1,898 | 1,979 | 2,078 | 2,015 | 2,022 | 1,964 | 1,960 | 2,146 | 1,980 | 1,935 |
| 2013 | 2,144 | 1,784 | 2,188 | 2,020 | 1,803 | 1,796 | 2,004 | 2,180 | 1,829 | 1,924 | 1,981 | 2,147 |
| 2014 | 1,972 | 2,011 | 1,774 | 1,935 | 2,095 | 1,878 | 2,001 | 2,358 | 2,451 | 1,864 | 1,860 | 1,940 |
| 2015 | 2,004 | 1,837 | 2,012 | 2,319 | 2,138 | 1,804 | 1,831 | 1,941 | 1,815 | 1,799 | 2,020 | 2,047 |
| 2016 | 2,013 | 2,084 | 1,990 | 1,817 | 1,890 | 1,913 | 1,990 | 1,996 | 1,970 | 2,149 | 1,855 | 1,722 |
| 2017 | 1,792 | 2,042 | 1,763 | 2,024 | 2,136 | 1,945 | 1,899 | 1,895 | 1,872 | 2,002 | 1,812 | 2,004 |
| 2018 | 2,186 | 2,313 | 1,836 | 2,057 | 2,036 | 1,859 | 1,902 | 1,774 | 1,859 | 1,660 | 1,924 | 1,981 |
| 2019 | 1,702 | 1,886 | 1,788 | 1,969 | 1,763 | 1,663 | 1,888 | 1,761 | 2,094 | 1,862 | 1,621 | 1,731 |
| 2020 | 2,013 | 1,828 | 1,605 | 1,402 | 1,352 | 1,404 | 1,953 | 1,609 | 1,773 | 1,794 | 1,803 | 1,831 |
| 2021 | 2,077 | 1,743 | 1,712 | 1,817 | 1,739 | 2,018 | 1,948 | 1,867 | 2,003 | 1,847 | 1,843 | 1,935 |
| 2022 | 2,054 | 2,205 | 1,993 | 1,946 | 2,032 | 2,179 | 1,936 | 1,952 | 1,975 | 1,830 | 1,985 | 1,631 |
| 2023 | 1,970 | 1,686 | 2,183 | 2,154 | 2,159 | 2,264 | 2,046 | 2,020 | 2,083 | 2,076 | 2,039 | 2,152 |
| 2024 | 2,311 | |||||||||||
| - = No Data Reported; -- = Not Applicable; NA = Not Available; W = Withheld to avoid disclosure of individual company data. |
| Release Date: 3/29/2024 |
| Next Release Date: 4/30/2024 |