|
Download Data (XLS File) |
|
||||||||
|
||||||||
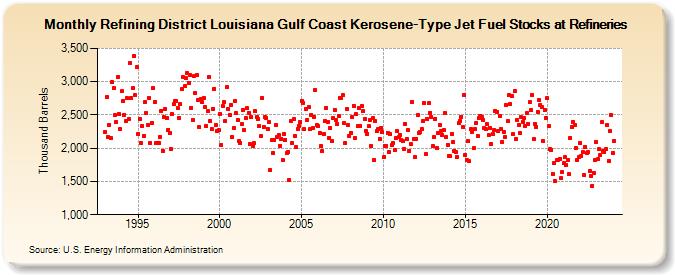
| Refining District Louisiana Gulf Coast Kerosene-Type Jet Fuel Stocks at Refineries (Thousand Barrels) | ||||||||
| Year | Jan | Feb | Mar | Apr | May | Jun | Jul | Aug | Sep | Oct | Nov | Dec |
|---|---|---|---|---|---|---|---|---|---|---|---|---|
| 1993 | 2,243 | 2,763 | 2,171 | 2,353 | 2,151 | 2,992 | 2,904 | 2,492 | 2,395 | 3,070 | 2,509 | 2,283 |
| 1994 | 2,854 | 2,712 | 2,503 | 2,404 | 2,748 | 2,433 | 3,282 | 2,754 | 2,900 | 3,386 | 2,794 | 3,213 |
| 1995 | 2,215 | 2,445 | 2,079 | 2,338 | 2,188 | 2,691 | 2,529 | 2,344 | 2,752 | 2,081 | 2,376 | 2,903 |
| 1996 | 2,694 | 2,072 | 2,072 | 2,083 | 2,171 | 2,559 | 1,962 | 2,468 | 2,593 | 2,447 | 2,279 | 2,233 |
| 1997 | 1,994 | 2,508 | 2,657 | 2,707 | 2,710 | 2,598 | 2,448 | 2,658 | 2,892 | 3,065 | 2,930 | 3,051 |
| 1998 | 3,125 | 2,981 | 3,105 | 2,610 | 2,430 | 3,082 | 2,829 | 3,101 | 2,719 | 2,317 | 2,745 | 2,690 |
| 1999 | 2,758 | 2,625 | 2,333 | 2,556 | 3,069 | 2,404 | 2,282 | 2,594 | 2,894 | 2,348 | 2,263 | 2,268 |
| 2000 | 2,513 | 2,047 | 2,635 | 2,694 | 2,405 | 2,918 | 2,588 | 2,506 | 2,653 | 2,166 | 2,303 | 2,706 |
| 2001 | 2,527 | 2,421 | 2,103 | 2,081 | 2,359 | 2,575 | 2,277 | 2,449 | 2,597 | 2,531 | 2,062 | 2,463 |
| 2002 | 2,029 | 2,071 | 2,558 | 2,468 | 2,437 | 2,335 | 2,179 | 2,759 | 2,316 | 2,468 | 2,455 | 2,291 |
| 2003 | 2,396 | 1,672 | 2,118 | 1,929 | 2,122 | 2,351 | 2,174 | 2,205 | 2,033 | 2,145 | 1,816 | 2,219 |
| 2004 | 2,130 | 1,925 | 1,936 | 1,522 | 2,409 | 2,078 | 2,441 | 2,185 | 2,020 | 2,289 | 2,335 | 2,396 |
| 2005 | 2,713 | 2,685 | 2,281 | 2,596 | 2,430 | 2,613 | 2,283 | 2,503 | 2,296 | 2,469 | 2,874 | 2,353 |
| 2006 | 2,331 | 2,228 | 2,032 | 1,954 | 2,208 | 2,402 | 2,609 | 2,400 | 2,158 | 2,302 | 2,110 | 2,460 |
| 2007 | 2,579 | 2,421 | 2,364 | 2,483 | 2,759 | 2,757 | 2,792 | 2,374 | 2,079 | 2,594 | 2,345 | 2,183 |
| 2008 | 2,234 | 2,462 | 2,639 | 2,155 | 2,510 | 2,329 | 2,605 | 2,336 | 2,632 | 2,557 | 2,435 | 2,256 |
| 2009 | 2,217 | 2,327 | 2,424 | 2,031 | 2,453 | 1,828 | 2,405 | 2,252 | 2,282 | 2,144 | 2,303 | 2,248 |
| 2010 | 1,867 | 2,040 | 2,032 | 2,233 | 1,940 | 2,208 | 2,047 | 2,080 | 1,968 | 2,149 | 2,260 | 2,163 |
| 2011 | 2,204 | 2,118 | 2,106 | 1,986 | 2,364 | 2,139 | 2,271 | 1,961 | 2,059 | 2,691 | 2,131 | 1,866 |
| 2012 | 2,142 | 2,496 | 2,234 | 2,241 | 2,281 | 2,416 | 2,679 | 1,914 | 2,432 | 2,674 | 2,536 | 2,469 |
| 2013 | 2,035 | 2,167 | 2,444 | 2,002 | 2,233 | 2,347 | 2,254 | 2,202 | 2,273 | 2,527 | 2,165 | 2,054 |
| 2014 | 1,883 | 1,876 | 2,218 | 2,099 | 1,962 | 1,943 | 1,868 | 2,377 | 2,407 | 2,475 | 2,318 | 2,794 |
| 2015 | 1,903 | 1,828 | 2,107 | 1,803 | 2,281 | 2,236 | 2,001 | 2,288 | 2,386 | 2,182 | 2,451 | 2,491 |
| 2016 | 2,473 | 2,421 | 2,300 | 2,282 | 2,358 | 2,198 | 2,309 | 2,066 | 2,219 | 2,277 | 2,559 | 2,550 |
| 2017 | 2,256 | 2,478 | 2,292 | 2,097 | 2,250 | 2,174 | 2,647 | 2,408 | 2,792 | 2,663 | 2,780 | 2,210 |
| 2018 | 2,860 | 2,140 | 2,419 | 2,355 | 2,228 | 2,462 | 2,396 | 2,458 | 2,338 | 2,528 | 2,366 | 2,691 |
| 2019 | 2,567 | 2,803 | 2,137 | 2,365 | 2,322 | 2,545 | 2,719 | 2,654 | 2,618 | 2,107 | 2,578 | 2,454 |
| 2020 | 2,752 | 2,331 | 1,981 | 1,979 | 1,619 | 1,775 | 1,501 | 1,817 | 1,829 | 1,835 | 1,549 | 1,635 |
| 2021 | 1,773 | 1,866 | 1,746 | 1,825 | 1,605 | 2,158 | 2,317 | 2,401 | 2,356 | 2,005 | 1,829 | 1,865 |
| 2022 | 2,080 | 1,890 | 1,936 | 1,600 | 2,024 | 1,922 | 1,938 | 1,656 | 1,587 | 1,437 | 1,633 | 1,816 |
| 2023 | 2,091 | 1,836 | 1,983 | 1,896 | 2,389 | 1,963 | 1,940 | 1,982 | 2,348 | 1,805 | 2,258 | 2,500 |
| 2024 | 1,931 | 2,109 | 2,297 | 2,096 | 1,912 | 2,293 | ||||||
| - = No Data Reported; -- = Not Applicable; NA = Not Available; W = Withheld to avoid disclosure of individual company data. |
| Release Date: 8/30/2024 |
| Next Release Date: 9/30/2024 |