|
Download Data (XLS File) |
|
||||||||
|
||||||||
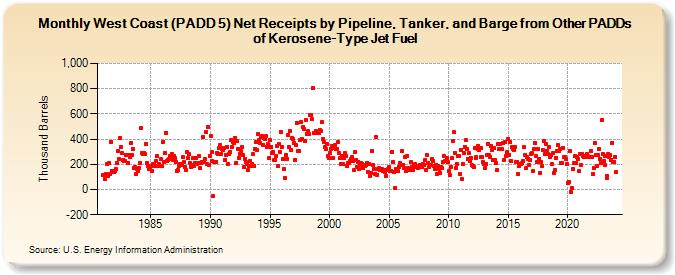
| West Coast (PADD 5) Net Receipts by Pipeline, Tanker, and Barge from Other PADDs of Kerosene-Type Jet Fuel (Thousand Barrels) | ||||||||
| Year | Jan | Feb | Mar | Apr | May | Jun | Jul | Aug | Sep | Oct | Nov | Dec |
|---|---|---|---|---|---|---|---|---|---|---|---|---|
| 1981 | 112 | 112 | 83 | 127 | 203 | 111 | 209 | 126 | 377 | 148 | 145 | 135 |
| 1982 | 145 | 160 | 207 | 303 | 242 | 409 | 336 | 288 | 237 | 224 | 228 | 271 |
| 1983 | 274 | 210 | 276 | 261 | 372 | 270 | 324 | 173 | 178 | 122 | 165 | 147 |
| 1984 | 170 | 212 | 491 | 292 | 280 | 293 | 278 | 365 | 213 | 187 | 165 | 179 |
| 1985 | 189 | 144 | 201 | 203 | 189 | 230 | 263 | 188 | 206 | 186 | 239 | 185 |
| 1986 | 379 | 215 | 290 | 451 | 225 | 238 | 242 | 266 | 267 | 284 | 233 | 268 |
| 1987 | 247 | 219 | 147 | 157 | 186 | 206 | 203 | 195 | 255 | 220 | 179 | 157 |
| 1988 | 298 | 249 | 281 | 214 | 182 | 198 | 250 | 185 | 214 | 252 | 205 | 208 |
| 1989 | 262 | 168 | 211 | 219 | 415 | 222 | 244 | 460 | 201 | 494 | 191 | 266 |
| 1990 | 427 | 296 | 226 | -55 | 220 | 215 | 222 | 287 | 280 | 329 | 352 | 280 |
| 1991 | 320 | 316 | 333 | 238 | 276 | 340 | 206 | 279 | 295 | 389 | 339 | 374 |
| 1992 | 369 | 412 | 211 | 382 | 322 | 247 | 281 | 302 | 337 | 275 | 180 | 245 |
| 1993 | 218 | 205 | 156 | 184 | 229 | 190 | 206 | 278 | 188 | 325 | 376 | 310 |
| 1994 | 440 | 393 | 366 | 415 | 425 | 354 | 410 | 403 | 423 | 336 | 359 | 250 |
| 1995 | 390 | 340 | 287 | 296 | 235 | 238 | 263 | 347 | 188 | 359 | 294 | 459 |
| 1996 | 337 | 246 | 160 | 92 | 277 | 245 | 436 | 335 | 462 | 317 | 409 | 399 |
| 1997 | 368 | 237 | 355 | 530 | 306 | 308 | 391 | 533 | 399 | 493 | 484 | 388 |
| 1998 | 554 | 441 | 461 | 439 | 593 | 594 | 558 | 808 | 449 | 449 | 468 | 451 |
| 1999 | 456 | 447 | 474 | 468 | 532 | 402 | 376 | 334 | 323 | 365 | 264 | 252 |
| 2000 | 290 | 321 | 342 | 248 | 332 | 350 | 322 | 325 | 375 | 289 | 247 | 204 |
| 2001 | 268 | 201 | 249 | 253 | 286 | 265 | 184 | 212 | 214 | 228 | 242 | 256 |
| 2002 | 223 | 156 | 297 | 237 | 175 | 222 | 161 | 193 | 212 | 204 | 168 | 184 |
| 2003 | 189 | 195 | 211 | 135 | 199 | 106 | 131 | 307 | 196 | 163 | 122 | 414 |
| 2004 | 119 | 165 | 170 | 156 | 155 | 159 | 148 | 158 | 137 | 106 | 156 | 164 |
| 2005 | 175 | 144 | 150 | 299 | 222 | 142 | 12 | 163 | 147 | 148 | 175 | 209 |
| 2006 | 196 | 303 | 197 | 173 | 254 | 146 | 269 | 168 | 152 | 155 | 218 | 178 |
| 2007 | 158 | 196 | 199 | 181 | 187 | 174 | 188 | 194 | 176 | 175 | 204 | 196 |
| 2008 | 236 | 158 | 274 | 213 | 176 | 194 | 193 | 239 | 224 | 188 | 159 | 198 |
| 2009 | 123 | 188 | 165 | 131 | 180 | 174 | 217 | 268 | 224 | 225 | 247 | 220 |
| 2010 | 143 | 113 | 179 | 248 | 385 | 454 | 292 | 167 | 201 | 265 | 264 | 123 |
| 2011 | 314 | 83 | 201 | 286 | 338 | 390 | 325 | 245 | 289 | 224 | 252 | 191 |
| 2012 | 186 | 181 | 329 | 251 | 260 | 325 | 348 | 314 | 256 | 326 | 257 | 215 |
| 2013 | 204 | 173 | 206 | 275 | 365 | 271 | 258 | 344 | 316 | 236 | 329 | 231 |
| 2014 | 207 | 156 | 365 | 319 | 359 | 324 | 319 | 371 | 236 | 379 | 267 | 297 |
| 2015 | 402 | 274 | 375 | 228 | 334 | 325 | 317 | 334 | 221 | 219 | 125 | 185 |
| 2016 | 200 | 206 | 210 | 226 | 334 | 275 | 168 | 256 | 246 | 194 | 235 | 285 |
| 2017 | 287 | 146 | 324 | 373 | 263 | 221 | 324 | 245 | 134 | 222 | 190 | 314 |
| 2018 | 382 | 283 | 361 | 309 | 282 | 335 | 254 | 277 | 202 | 289 | 131 | 153 |
| 2019 | 252 | 304 | 350 | 304 | 320 | 207 | 209 | 330 | 257 | 257 | 242 | 204 |
| 2020 | 50 | 61 | 305 | -22 | 10 | 165 | 211 | 264 | 212 | 261 | 240 | 146 |
| 2021 | 278 | 195 | 285 | 268 | 261 | 257 | 266 | 280 | 262 | 259 | 255 | 307 |
| 2022 | 261 | 125 | 174 | 371 | 275 | 184 | 273 | 322 | 245 | 211 | 550 | 285 |
| 2023 | 225 | 191 | 265 | 111 | 93 | 284 | 259 | 274 | 238 | 373 | 222 | 221 |
| 2024 | 259 | |||||||||||
| - = No Data Reported; -- = Not Applicable; NA = Not Available; W = Withheld to avoid disclosure of individual company data. |
| Release Date: 3/29/2024 |
| Next Release Date: 4/30/2024 |