|
Download Data (XLS File) |
|
||||||||
|
||||||||
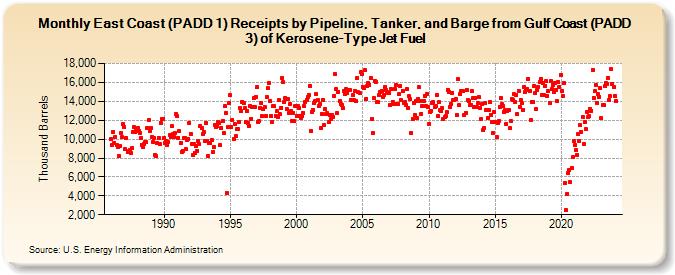
| East Coast (PADD 1) Receipts by Pipeline, Tanker, and Barge from Gulf Coast (PADD 3) of Kerosene-Type Jet Fuel (Thousand Barrels) | ||||||||
| Year | Jan | Feb | Mar | Apr | May | Jun | Jul | Aug | Sep | Oct | Nov | Dec |
|---|---|---|---|---|---|---|---|---|---|---|---|---|
| 1986 | 9,966 | 9,356 | 10,793 | 9,567 | 10,226 | 9,331 | 9,209 | 8,216 | 9,265 | 10,607 | 10,201 | 11,558 |
| 1987 | 11,257 | 8,918 | 10,141 | 8,653 | 8,717 | 8,894 | 8,557 | 9,065 | 10,770 | 11,236 | 10,707 | 11,105 |
| 1988 | 11,165 | 10,867 | 10,643 | 10,065 | 9,425 | 9,144 | 9,463 | 9,644 | 9,664 | 11,195 | 11,989 | 10,884 |
| 1989 | 11,225 | 10,262 | 9,739 | 10,126 | 8,352 | 8,171 | 9,610 | 10,168 | 9,475 | 11,736 | 12,146 | 12,168 |
| 1990 | 10,149 | 9,623 | 9,849 | 9,326 | 9,675 | 10,401 | 10,243 | 11,336 | 10,521 | 10,228 | 10,633 | 12,616 |
| 1991 | 12,397 | 10,131 | 10,818 | 9,574 | 8,672 | 8,775 | 10,104 | 10,134 | 8,910 | 9,907 | 10,029 | 11,734 |
| 1992 | 10,580 | 9,534 | 8,337 | 9,473 | 8,531 | 9,289 | 8,791 | 9,808 | 9,448 | 11,421 | 11,142 | 10,489 |
| 1993 | 10,798 | 9,765 | 11,736 | 9,806 | 8,198 | 9,571 | 9,557 | 9,894 | 8,622 | 9,197 | 11,538 | 11,281 |
| 1994 | 11,364 | 11,814 | 11,710 | 9,396 | 11,197 | 11,931 | 10,688 | 13,464 | 12,768 | 4,262 | 11,291 | 13,804 |
| 1995 | 14,637 | 11,269 | 12,038 | 10,008 | 11,549 | 10,314 | 11,024 | 11,062 | 11,855 | 13,304 | 12,993 | 13,957 |
| 1996 | 13,767 | 13,281 | 11,832 | 12,956 | 11,723 | 11,426 | 13,506 | 12,176 | 13,360 | 14,335 | 13,417 | 14,454 |
| 1997 | 15,467 | 11,830 | 11,881 | 13,328 | 13,811 | 12,406 | 13,154 | 13,443 | 12,420 | 14,461 | 15,371 | 15,914 |
| 1998 | 14,062 | 12,447 | 11,818 | 13,475 | 13,472 | 12,429 | 12,946 | 12,341 | 14,097 | 12,620 | 13,317 | 16,485 |
| 1999 | 16,007 | 13,928 | 14,395 | 13,154 | 14,197 | 12,765 | 13,723 | 12,979 | 11,925 | 12,789 | 11,865 | 13,511 |
| 2000 | 12,447 | 13,468 | 13,300 | 12,495 | 12,283 | 12,439 | 12,765 | 13,482 | 13,965 | 14,139 | 14,411 | 14,641 |
| 2001 | 15,664 | 10,873 | 12,880 | 13,114 | 13,870 | 14,059 | 14,729 | 14,127 | 13,487 | 13,670 | 11,170 | 12,698 |
| 2002 | 14,163 | 11,496 | 13,197 | 12,623 | 12,727 | 11,780 | 12,594 | 12,086 | 12,543 | 12,363 | 14,572 | 16,883 |
| 2003 | 15,297 | 12,719 | 15,012 | 14,046 | 13,725 | 13,655 | 13,248 | 15,134 | 14,760 | 15,249 | 14,924 | 15,226 |
| 2004 | 15,153 | 14,115 | 14,107 | 14,643 | 14,095 | 15,073 | 14,001 | 16,481 | 14,938 | 14,903 | 17,047 | 16,840 |
| 2005 | 15,546 | 15,356 | 17,293 | 14,276 | 15,565 | 15,900 | 15,756 | 16,507 | 12,172 | 10,619 | 14,320 | 16,199 |
| 2006 | 16,059 | 13,885 | 13,876 | 14,648 | 14,992 | 15,131 | 14,486 | 14,701 | 15,519 | 15,179 | 14,960 | 14,852 |
| 2007 | 14,925 | 13,653 | 15,249 | 13,938 | 13,705 | 15,279 | 15,688 | 13,726 | 13,743 | 14,737 | 15,664 | 14,092 |
| 2008 | 15,121 | 13,845 | 13,915 | 13,622 | 15,284 | 13,340 | 14,509 | 14,196 | 10,634 | 12,139 | 13,829 | 12,554 |
| 2009 | 14,048 | 12,273 | 14,246 | 15,476 | 14,017 | 12,704 | 13,546 | 14,072 | 14,591 | 13,546 | 14,777 | 13,407 |
| 2010 | 11,639 | 12,836 | 13,017 | 13,792 | 13,897 | 13,370 | 13,533 | 14,670 | 12,437 | 13,877 | 13,027 | 12,923 |
| 2011 | 13,273 | 12,086 | 12,301 | 12,418 | 12,838 | 15,241 | 15,026 | 13,383 | 13,745 | 14,923 | 14,180 | 14,125 |
| 2012 | 14,259 | 12,549 | 16,308 | 13,604 | 14,727 | 15,058 | 15,060 | 15,041 | 12,548 | 12,803 | 15,227 | 14,132 |
| 2013 | 13,991 | 13,614 | 13,627 | 15,097 | 14,393 | 13,406 | 14,352 | 13,411 | 13,837 | 14,470 | 13,311 | 12,107 |
| 2014 | 13,754 | 10,923 | 11,222 | 13,790 | 13,082 | 12,236 | 13,104 | 13,888 | 12,589 | 11,766 | 10,593 | 12,887 |
| 2015 | 11,792 | 10,199 | 11,738 | 11,912 | 13,434 | 14,332 | 13,687 | 13,497 | 12,883 | 13,037 | 11,605 | 12,939 |
| 2016 | 13,131 | 11,122 | 11,907 | 14,244 | 14,174 | 14,722 | 13,936 | 14,671 | 12,637 | 15,100 | 13,426 | 14,156 |
| 2017 | 13,778 | 13,096 | 15,539 | 15,001 | 15,218 | 15,317 | 16,368 | 15,095 | 12,061 | 13,971 | 13,976 | 15,595 |
| 2018 | 14,864 | 13,175 | 15,243 | 15,519 | 16,000 | 16,346 | 14,677 | 15,909 | 14,621 | 15,647 | 16,104 | 14,586 |
| 2019 | 15,036 | 13,818 | 16,132 | 15,286 | 15,752 | 14,978 | 15,919 | 15,202 | 13,988 | 16,064 | 15,564 | 16,808 |
| 2020 | 15,087 | 14,533 | 15,902 | 5,345 | 2,486 | 4,235 | 6,398 | 6,740 | 5,446 | 6,921 | 8,063 | 9,775 |
| 2021 | 9,418 | 8,837 | 8,352 | 10,489 | 9,784 | 11,445 | 10,796 | 12,329 | 9,534 | 11,800 | 11,016 | 12,849 |
| 2022 | 12,364 | 12,401 | 13,206 | 13,014 | 17,357 | 14,399 | 15,088 | 15,725 | 13,849 | 14,735 | 14,492 | 15,386 |
| 2023 | 12,205 | 13,600 | 13,645 | 15,589 | 15,912 | 15,870 | 16,470 | 14,086 | 14,532 | 17,375 | 15,818 | 15,548 |
| 2024 | 14,607 | |||||||||||
| - = No Data Reported; -- = Not Applicable; NA = Not Available; W = Withheld to avoid disclosure of individual company data. |
| Release Date: 3/29/2024 |
| Next Release Date: 4/30/2024 |