|
Download Data (XLS File) |
|
||||||||
|
||||||||
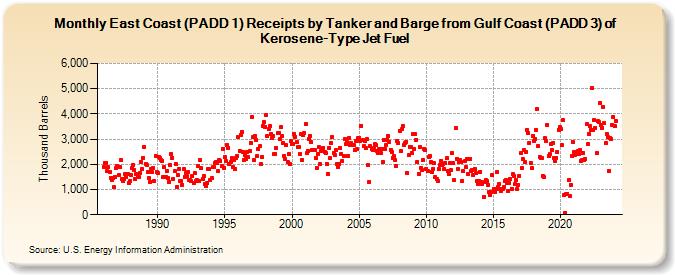
| East Coast (PADD 1) Receipts by Tanker and Barge from Gulf Coast (PADD 3) of Kerosene-Type Jet Fuel (Thousand Barrels) | ||||||||
| Year | Jan | Feb | Mar | Apr | May | Jun | Jul | Aug | Sep | Oct | Nov | Dec |
|---|---|---|---|---|---|---|---|---|---|---|---|---|
| 1986 | 1,884 | 2,069 | 2,058 | 1,715 | 1,874 | 1,698 | 1,469 | 1,386 | 1,443 | 1,089 | 1,515 | 1,846 |
| 1987 | 1,915 | 1,581 | 1,879 | 2,177 | 1,412 | 1,342 | 1,398 | 1,625 | 1,486 | 1,633 | 1,258 | 1,331 |
| 1988 | 1,595 | 1,838 | 1,976 | 1,782 | 1,412 | 1,616 | 1,541 | 1,514 | 1,636 | 2,110 | 1,818 | 2,257 |
| 1989 | 2,704 | 2,022 | 1,990 | 1,700 | 1,442 | 1,316 | 1,808 | 1,694 | 1,847 | 1,328 | 2,323 | 1,691 |
| 1990 | 1,641 | 2,298 | 2,238 | 2,177 | 2,150 | 1,514 | 1,881 | 1,514 | 1,739 | 1,454 | 1,307 | 1,968 |
| 1991 | 2,399 | 2,267 | 1,416 | 1,717 | 2,028 | 1,096 | 1,584 | 1,831 | 1,319 | 1,338 | 1,194 | 1,814 |
| 1992 | 1,502 | 1,647 | 1,529 | 1,694 | 1,374 | 1,390 | 1,335 | 1,521 | 1,245 | 1,649 | 1,341 | 1,384 |
| 1993 | 1,925 | 1,344 | 2,153 | 1,839 | 1,409 | 1,527 | 1,228 | 1,133 | 1,243 | 1,831 | 1,802 | 1,393 |
| 1994 | 1,447 | 1,875 | 1,909 | 2,055 | 2,105 | 2,036 | 1,733 | 2,187 | 2,140 | 1,945 | 2,609 | 1,856 |
| 1995 | 2,278 | 2,121 | 2,758 | 2,659 | 2,004 | 2,089 | 2,244 | 1,909 | 2,168 | 1,819 | 2,256 | 2,331 |
| 1996 | 3,065 | 2,544 | 3,169 | 3,285 | 2,485 | 2,160 | 2,358 | 2,208 | 2,502 | 2,296 | 2,523 | 2,860 |
| 1997 | 3,892 | 3,064 | 2,174 | 3,126 | 2,964 | 2,331 | 2,610 | 2,707 | 2,011 | 2,292 | 3,538 | 3,659 |
| 1998 | 3,491 | 3,953 | 3,110 | 3,387 | 3,507 | 3,195 | 3,045 | 3,108 | 2,394 | 2,410 | 2,654 | 3,242 |
| 1999 | 3,251 | 2,995 | 3,461 | 3,137 | 2,838 | 2,346 | 2,218 | 2,747 | 2,095 | 2,411 | 2,001 | 2,930 |
| 2000 | 2,805 | 2,807 | 3,208 | 3,101 | 2,889 | 2,670 | 2,701 | 2,400 | 3,196 | 2,179 | 3,152 | 3,242 |
| 2001 | 3,598 | 2,433 | 2,526 | 3,010 | 3,139 | 2,871 | 2,559 | 2,576 | 2,561 | 2,247 | 1,870 | 2,424 |
| 2002 | 2,669 | 2,010 | 2,541 | 2,619 | 2,655 | 2,492 | 2,463 | 2,017 | 1,622 | 2,655 | 2,233 | 2,835 |
| 2003 | 3,076 | 2,459 | 2,380 | 2,556 | 2,031 | 1,881 | 2,026 | 2,663 | 2,411 | 2,140 | 2,344 | 2,996 |
| 2004 | 2,786 | 2,871 | 2,342 | 3,037 | 2,769 | 2,838 | 2,780 | 2,756 | 2,556 | 2,924 | 2,589 | 3,045 |
| 2005 | 3,055 | 2,939 | 3,534 | 2,954 | 2,707 | 2,914 | 2,631 | 2,987 | 1,957 | 1,307 | 2,709 | 2,614 |
| 2006 | 2,565 | 2,642 | 2,794 | 2,747 | 2,509 | 2,430 | 2,600 | 2,438 | 2,591 | 2,096 | 2,976 | 2,592 |
| 2007 | 2,780 | 2,980 | 3,130 | 2,902 | 2,583 | 2,471 | 2,257 | 2,344 | 2,175 | 1,934 | 2,940 | 2,847 |
| 2008 | 3,333 | 2,512 | 3,387 | 3,517 | 2,756 | 2,852 | 2,889 | 1,646 | 2,361 | 2,697 | 2,672 | 2,451 |
| 2009 | 3,183 | 2,611 | 3,196 | 2,980 | 2,093 | 1,629 | 2,676 | 1,871 | 1,771 | 2,167 | 2,616 | 2,567 |
| 2010 | 1,809 | 1,752 | 2,300 | 2,321 | 2,092 | 1,678 | 1,821 | 2,044 | 1,487 | 1,435 | 1,353 | 1,822 |
| 2011 | 1,986 | 2,131 | 1,990 | 2,028 | 1,821 | 2,061 | 2,233 | 1,741 | 1,630 | 2,069 | 1,759 | 2,445 |
| 2012 | 2,037 | 1,363 | 3,433 | 2,219 | 1,809 | 2,072 | 2,157 | 2,098 | 1,330 | 1,724 | 2,114 | 1,886 |
| 2013 | 2,221 | 1,604 | 2,206 | 2,217 | 1,726 | 1,790 | 1,571 | 1,810 | 1,658 | 1,325 | 1,230 | 1,348 |
| 2014 | 1,708 | 1,288 | 1,226 | 714 | 1,291 | 1,383 | 1,331 | 1,190 | 903 | 782 | 884 | 1,561 |
| 2015 | 1,039 | 915 | 1,012 | 1,694 | 1,095 | 1,234 | 1,016 | 954 | 1,032 | 1,085 | 1,338 | 1,372 |
| 2016 | 1,243 | 931 | 1,267 | 1,424 | 1,037 | 1,604 | 1,527 | 1,218 | 1,393 | 1,021 | 1,186 | 1,553 |
| 2017 | 2,443 | 1,854 | 2,221 | 2,579 | 2,095 | 2,506 | 3,367 | 3,248 | 2,853 | 2,070 | 1,853 | 3,139 |
| 2018 | 2,937 | 3,006 | 3,364 | 4,175 | 2,729 | 2,300 | 2,257 | 2,246 | 1,546 | 1,486 | 3,027 | 2,927 |
| 2019 | 3,560 | 2,322 | 2,390 | 2,794 | 2,576 | 2,826 | 2,264 | 2,139 | 2,265 | 2,489 | 3,373 | 3,469 |
| 2020 | 3,413 | 2,750 | 3,756 | 781 | 84 | 802 | 840 | 1,379 | 751 | 1,190 | 2,343 | 2,867 |
| 2021 | 2,505 | 2,383 | 2,443 | 2,512 | 2,407 | 2,566 | 2,138 | 2,161 | 2,449 | 2,190 | 2,203 | 3,593 |
| 2022 | 2,791 | 3,211 | 3,518 | 3,375 | 5,010 | 3,370 | 3,763 | 3,449 | 2,434 | 3,704 | 3,688 | 4,418 |
| 2023 | 3,578 | 3,457 | 4,280 | 3,634 | 2,838 | 3,211 | 3,066 | 1,738 | 3,052 | 3,018 | 3,565 | 3,893 |
| 2024 | 3,500 | |||||||||||
| - = No Data Reported; -- = Not Applicable; NA = Not Available; W = Withheld to avoid disclosure of individual company data. |
| Release Date: 3/29/2024 |
| Next Release Date: 4/30/2024 |