|
Download Data (XLS File) |
|
||||||||
|
||||||||
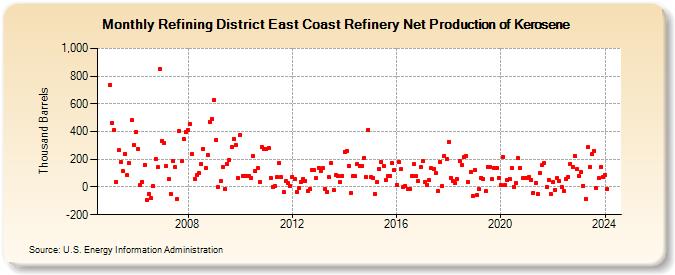
| Refining District East Coast Refinery Net Production of Kerosene (Thousand Barrels) | ||||||||
| Year | Jan | Feb | Mar | Apr | May | Jun | Jul | Aug | Sep | Oct | Nov | Dec |
|---|---|---|---|---|---|---|---|---|---|---|---|---|
| 2005 | 736 | 461 | 411 | 38 | 264 | 179 | 113 | 241 | 86 | 171 | 481 | 304 |
| 2006 | 395 | 275 | 11 | 38 | 160 | -96 | -48 | -81 | 6 | 199 | 141 | 849 |
| 2007 | 334 | 315 | 151 | 55 | -48 | 187 | 142 | -86 | 404 | 184 | 346 | 396 |
| 2008 | 413 | 453 | 237 | 58 | 87 | 99 | 164 | 276 | 136 | 231 | 472 | 489 |
| 2009 | 630 | 342 | -2 | 41 | 147 | -15 | 168 | 196 | 285 | 345 | 304 | 66 |
| 2010 | 376 | 82 | 80 | 81 | 81 | 67 | 223 | 113 | 135 | 39 | 291 | 277 |
| 2011 | 273 | 284 | 68 | -3 | 6 | 73 | 173 | 70 | -33 | 41 | 26 | 8 |
| 2012 | 74 | 60 | -34 | -8 | 35 | 60 | 46 | -30 | -16 | 125 | 124 | 63 |
| 2013 | 139 | 118 | 134 | -13 | -34 | 70 | 174 | -21 | 85 | 76 | 36 | 82 |
| 2014 | 256 | 262 | 151 | -45 | 76 | 78 | 163 | 150 | 151 | 211 | 73 | 414 |
| 2015 | 69 | 62 | -49 | 37 | 131 | 181 | 155 | 47 | 79 | 82 | 173 | 122 |
| 2016 | 17 | 177 | 129 | -3 | 10 | -11 | -11 | 80 | 163 | 76 | 43 | 147 |
| 2017 | 191 | 38 | 14 | 47 | 135 | 129 | 101 | -31 | 182 | 7 | 225 | 202 |
| 2018 | 327 | 65 | 40 | 26 | 57 | 186 | 159 | 216 | 222 | 35 | 106 | -68 |
| 2019 | 124 | -57 | -18 | 68 | 56 | -30 | 147 | 143 | 56 | 137 | 135 | 68 |
| 2020 | 13 | 219 | 15 | 48 | 61 | 139 | 2 | 28 | 208 | 138 | 63 | 64 |
| 2021 | 66 | 74 | 51 | -40 | 30 | -48 | 101 | 162 | 173 | -1 | 53 | -51 |
| 2022 | 36 | -23 | 63 | 43 | 1 | -29 | 55 | 71 | 169 | 144 | 227 | 127 |
| 2023 | 76 | 107 | 10 | -84 | 286 | 146 | 235 | 262 | -10 | 62 | 144 | 73 |
| 2024 | 84 | |||||||||||
| - = No Data Reported; -- = Not Applicable; NA = Not Available; W = Withheld to avoid disclosure of individual company data. |
| Release Date: 3/29/2024 |
| Next Release Date: 4/30/2024 |
Referring Pages: