|
Download Data (XLS File) |
|
||||||||
|
||||||||
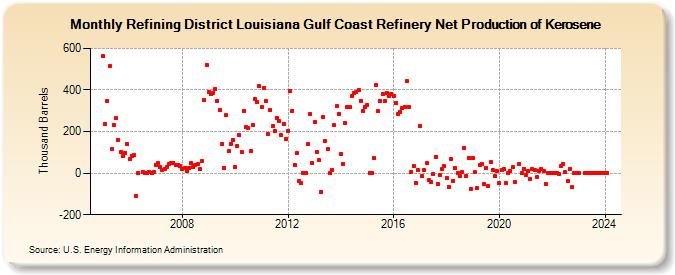
| Refining District Louisiana Gulf Coast Refinery Net Production of Kerosene (Thousand Barrels) | ||||||||
| Year | Jan | Feb | Mar | Apr | May | Jun | Jul | Aug | Sep | Oct | Nov | Dec |
|---|---|---|---|---|---|---|---|---|---|---|---|---|
| 2005 | 561 | 238 | 348 | 514 | 116 | 231 | 263 | 160 | 101 | 81 | 99 | 141 |
| 2006 | 67 | 84 | 86 | -109 | 0 | 4 | 0 | 0 | 5 | 0 | 5 | |
| 2007 | 41 | 49 | 31 | 15 | 19 | 28 | 45 | 51 | 51 | 38 | 38 | 32 |
| 2008 | 22 | 24 | 10 | 27 | 47 | 30 | 37 | 42 | 18 | 57 | 350 | 521 |
| 2009 | 390 | 381 | 386 | 406 | 349 | 303 | 141 | 27 | 279 | 105 | 142 | 160 |
| 2010 | 29 | 132 | 184 | 103 | 301 | 220 | 217 | 105 | 233 | 357 | 341 | 418 |
| 2011 | 320 | 408 | 345 | 188 | 304 | 226 | 203 | 264 | 249 | 182 | 238 | 165 |
| 2012 | 203 | 395 | 301 | 41 | 95 | -40 | -49 | 0 | 0 | 138 | 284 | 51 |
| 2013 | 246 | 103 | 61 | -89 | 270 | 155 | 116 | -1 | 16 | 230 | 321 | 285 |
| 2014 | 93 | 45 | 242 | 320 | 316 | 371 | 387 | 391 | 398 | 347 | 299 | 319 |
| 2015 | 326 | 1 | 0 | 74 | 426 | 300 | 346 | 383 | 348 | 385 | 371 | 382 |
| 2016 | 369 | 339 | 284 | 293 | 312 | 319 | 441 | 319 | 7 | 35 | -46 | 15 |
| 2017 | 229 | -13 | 14 | 48 | -35 | -43 | -2 | 79 | -51 | -7 | 19 | 35 |
| 2018 | -23 | -69 | 70 | -36 | 24 | 2 | -16 | 5 | 121 | -13 | 71 | -74 |
| 2019 | 72 | 4 | -73 | 41 | 43 | -54 | 24 | -62 | 53 | 15 | -15 | 11 |
| 2020 | -48 | 13 | 20 | -49 | -1 | 9 | 28 | -44 | 43 | 0 | 22 | |
| 2021 | -11 | 9 | -29 | 18 | 15 | -19 | 12 | 19 | 9 | -51 | 0 | 0 |
| 2022 | 0 | 0 | 0 | -2 | 33 | 43 | 4 | -38 | 20 | -68 | 0 | 0 |
| 2023 | 0 | 0 | 0 | 0 | 0 | 0 | 0 | 0 | 0 | 0 | ||
| 2024 | 0 | |||||||||||
| - = No Data Reported; -- = Not Applicable; NA = Not Available; W = Withheld to avoid disclosure of individual company data. |
| Release Date: 3/29/2024 |
| Next Release Date: 4/30/2024 |