|
Download Data (XLS File) |
|
||||||||
|
||||||||
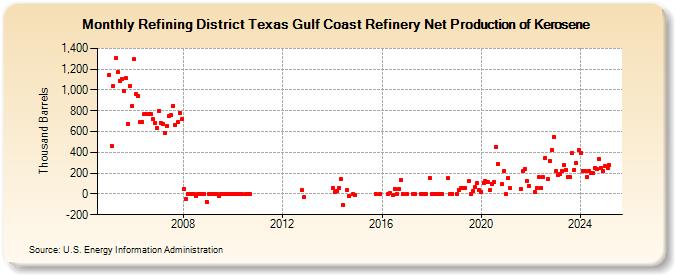
| Refining District Texas Gulf Coast Refinery Net Production of Kerosene (Thousand Barrels) | ||||||||
| Year | Jan | Feb | Mar | Apr | May | Jun | Jul | Aug | Sep | Oct | Nov | Dec |
|---|---|---|---|---|---|---|---|---|---|---|---|---|
| 2005 | 1,148 | 464 | 1,040 | 1,306 | 1,171 | 1,091 | 1,107 | 986 | 1,113 | 677 | 1,042 | 842 |
| 2006 | 1,294 | 959 | 942 | 693 | 691 | 766 | 767 | 765 | 767 | 719 | 685 | 638 |
| 2007 | 797 | 685 | 675 | 588 | 656 | 751 | 755 | 850 | 660 | 689 | 779 | 718 |
| 2008 | 50 | -47 | 1 | 1 | 2 | -2 | -23 | 1 | 1 | 2 | 1 | -77 |
| 2009 | 1 | 2 | 1 | 2 | 2 | -24 | 1 | 1 | 1 | 1 | 1 | 1 |
| 2010 | 1 | 1 | 1 | 2 | 1 | 1 | 1 | 1 | ||||
| 2012 | 34 | -34 | ||||||||||
| 2014 | 56 | 14 | 31 | 60 | 141 | -107 | 35 | -24 | -1 | -11 | ||
| 2015 | 1 | -1 | ||||||||||
| 2016 | 3 | 5 | -7 | 50 | -1 | 43 | 133 | 1 | ||||
| 2017 | -1 | 1 | -3 | 1 | 2 | -2 | 156 | |||||
| 2018 | -1 | 3 | -2 | 3 | -3 | 1 | 150 | -1 | 1 | |||
| 2019 | -1 | 38 | 57 | 59 | 59 | 121 | -1 | 30 | 66 | 102 | 37 | |
| 2020 | 22 | 107 | 120 | 112 | 33 | 100 | 110 | 452 | 291 | 95 | 219 | |
| 2021 | -4 | 152 | 54 | 50 | 217 | 237 | 120 | 81 | ||||
| 2022 | 20 | 61 | 158 | 60 | 158 | 347 | 145 | 317 | 419 | 551 | ||
| 2023 | 218 | 185 | 193 | 217 | 277 | 234 | 167 | 160 | 177 | 234 | 300 | 422 |
| 2024 | 398 | |||||||||||
| - = No Data Reported; -- = Not Applicable; NA = Not Available; W = Withheld to avoid disclosure of individual company data. |
| Release Date: 3/29/2024 |
| Next Release Date: 4/30/2024 |