|
Download Data (XLS File) |
|
||||||||
|
||||||||
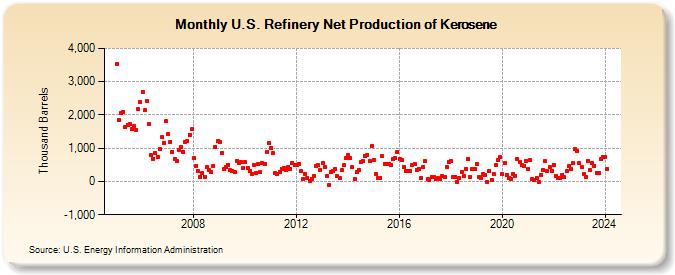
| U.S. Refinery Net Production of Kerosene (Thousand Barrels) | ||||||||
| Year | Jan | Feb | Mar | Apr | May | Jun | Jul | Aug | Sep | Oct | Nov | Dec |
|---|---|---|---|---|---|---|---|---|---|---|---|---|
| 2005 | 3,517 | 1,853 | 2,049 | 2,091 | 1,650 | 1,700 | 1,727 | 1,566 | 1,658 | 1,555 | 2,173 | 2,394 |
| 2006 | 2,704 | 2,137 | 2,407 | 1,723 | 793 | 675 | 846 | 748 | 983 | 1,331 | 1,150 | 1,809 |
| 2007 | 1,414 | 1,189 | 893 | 680 | 607 | 947 | 1,026 | 891 | 1,196 | 1,212 | 1,405 | 1,574 |
| 2008 | 700 | 470 | 309 | 146 | 261 | 146 | 441 | 331 | 291 | 461 | 1,039 | 1,201 |
| 2009 | 1,175 | 869 | 379 | 442 | 506 | 343 | 324 | 289 | 625 | 544 | 595 | 418 |
| 2010 | 581 | 395 | 309 | 237 | 506 | 260 | 534 | 270 | 547 | 528 | 894 | 1,161 |
| 2011 | 1,013 | 854 | 261 | 235 | 283 | 382 | 394 | 344 | 437 | 375 | 554 | 497 |
| 2012 | 481 | 529 | 314 | 70 | 221 | 100 | 10 | 70 | 164 | 454 | 481 | 355 |
| 2013 | 555 | 441 | 159 | -107 | 296 | 317 | 375 | 160 | 89 | 337 | 486 | 690 |
| 2014 | 783 | 693 | 434 | 75 | 283 | 356 | 573 | 606 | 776 | 804 | 611 | 1,064 |
| 2015 | 647 | 234 | 111 | 116 | 757 | 521 | 526 | 515 | 499 | 670 | 695 | 873 |
| 2016 | 672 | 652 | 423 | 313 | 308 | 306 | 495 | 533 | 355 | 380 | 111 | 444 |
| 2017 | 603 | 70 | 35 | 139 | 137 | 70 | 107 | 85 | 155 | 148 | 445 | 597 |
| 2018 | 609 | 143 | 144 | -15 | 106 | 286 | 149 | 385 | 672 | 136 | 369 | 373 |
| 2019 | 538 | 131 | 104 | 215 | 192 | -11 | 325 | 49 | 229 | 494 | 651 | 738 |
| 2020 | 217 | 559 | 199 | 104 | 88 | 230 | 177 | 663 | 594 | 495 | 472 | 612 |
| 2021 | 375 | 640 | 62 | 42 | 107 | -19 | 201 | 353 | 603 | 310 | 428 | 317 |
| 2022 | 509 | 176 | 106 | 114 | 202 | 121 | 301 | 450 | 377 | 551 | 969 | 907 |
| 2023 | 542 | 422 | 233 | 137 | 626 | 340 | 552 | 467 | 267 | 266 | 660 | 737 |
| 2024 | 746 | |||||||||||
| - = No Data Reported; -- = Not Applicable; NA = Not Available; W = Withheld to avoid disclosure of individual company data. |
| Release Date: 3/29/2024 |
| Next Release Date: 4/30/2024 |
Referring Pages: