|
Download Data (XLS File) |
|
||||||||
|
||||||||
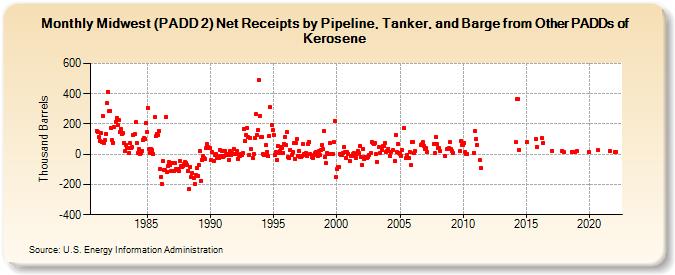
| Midwest (PADD 2) Net Receipts by Pipeline, Tanker, and Barge from Other PADDs of Kerosene (Thousand Barrels) | ||||||||
| Year | Jan | Feb | Mar | Apr | May | Jun | Jul | Aug | Sep | Oct | Nov | Dec |
|---|---|---|---|---|---|---|---|---|---|---|---|---|
| 1981 | 152 | 146 | 112 | 88 | 139 | 82 | 252 | 77 | 91 | 136 | 337 | 413 |
| 1982 | 284 | 289 | 172 | 91 | 77 | 177 | 216 | 242 | 191 | 225 | 146 | 170 |
| 1983 | 131 | 142 | 75 | 19 | 62 | 40 | 38 | 10 | 71 | 38 | 46 | 127 |
| 1984 | 132 | 211 | 76 | 8 | 34 | 3 | 6 | 24 | 96 | 105 | 102 | 204 |
| 1985 | 146 | 305 | 35 | 9 | 33 | 25 | 2 | 244 | 118 | 135 | 128 | 154 |
| 1986 | -95 | -149 | -194 | -47 | -102 | -106 | 245 | -115 | -77 | -54 | -71 | -114 |
| 1987 | -60 | -112 | -59 | -97 | -104 | -95 | -111 | -42 | -81 | -83 | -80 | -67 |
| 1988 | -52 | -57 | -69 | -111 | -227 | -83 | -149 | -127 | -158 | -198 | -138 | -92 |
| 1989 | -141 | -70 | 21 | -174 | -36 | -15 | -24 | -33 | 39 | 66 | 46 | 44 |
| 1990 | 40 | -38 | 16 | -44 | -3 | 0 | -26 | -12 | -27 | 29 | -12 | 19 |
| 1991 | -20 | -10 | 22 | -4 | 0 | -5 | -35 | 21 | -6 | 5 | 37 | -1 |
| 1992 | 4 | 23 | -32 | -4 | -12 | 0 | -6 | 6 | 167 | 85 | 127 | 174 |
| 1993 | 114 | -3 | 110 | 32 | -22 | 0 | 106 | 264 | 128 | 157 | 491 | 250 |
| 1994 | 113 | 117 | -1 | -4 | -4 | 60 | 17 | -14 | 123 | 311 | 192 | 158 |
| 1995 | 130 | -8 | 16 | -36 | 55 | 6 | 20 | 49 | 39 | 10 | 69 | 116 |
| 1996 | 58 | 144 | -20 | -27 | 28 | -8 | 14 | 75 | -34 | 72 | 100 | -12 |
| 1997 | 24 | -21 | -21 | -13 | 69 | 4 | -2 | 8 | -15 | 69 | 83 | 2 |
| 1998 | -19 | -22 | -7 | 5 | 16 | 0 | -13 | 18 | -6 | 25 | 62 | 32 |
| 1999 | 155 | -19 | -59 | 8 | 0 | 0 | 74 | 0 | 3 | 83 | 220 | -151 |
| 2000 | -98 | -83 | -83 | 2 | -7 | -2 | 5 | 48 | 16 | -24 | 14 | 2 |
| 2001 | -43 | -14 | -11 | 0 | 6 | -6 | -23 | 4 | 24 | 6 | 53 | -17 |
| 2002 | -69 | 37 | -32 | -18 | -22 | -22 | -16 | -7 | 5 | 82 | 76 | 65 |
| 2003 | 72 | -1 | -51 | 50 | 10 | 29 | 55 | 54 | 76 | 12 | ||
| 2004 | 19 | 35 | -12 | 15 | 25 | -44 | 128 | 15 | 70 | 6 | ||
| 2005 | 4 | -10 | 26 | 172 | -24 | -5 | -23 | 15 | -73 | 78 | ||
| 2006 | 78 | 7 | 20 | 63 | 67 | 79 | 53 | |||||
| 2007 | 34 | 39 | 15 | 70 | 5 | 115 | 65 | |||||
| 2008 | 43 | 39 | 19 | -15 | 33 | 39 | 78 | |||||
| 2009 | 33 | 23 | 9 | 18 | 88 | 64 | ||||||
| 2010 | 64 | 75 | 14 | 3 | 1 | 11 | 154 | |||||
| 2011 | 100 | 63 | -40 | -90 | ||||||||
| 2012 | -100 | |||||||||||
| 2014 | 78 | 364 | 363 | 27 | ||||||||
| 2015 | 78 | 100 | 50 | |||||||||
| 2016 | 106 | 76 | ||||||||||
| 2017 | 24 | 23 | ||||||||||
| 2018 | 12 | 16 | 17 | |||||||||
| 2019 | 20 | 14 | ||||||||||
| 2020 | 25 | |||||||||||
| 2021 | 19 | |||||||||||
| 2022 | 13 | 13 | ||||||||||
| - = No Data Reported; -- = Not Applicable; NA = Not Available; W = Withheld to avoid disclosure of individual company data. |
| Release Date: 3/29/2024 |
| Next Release Date: 4/30/2024 |