|
Download Data (XLS File) |
|
||||||||
|
||||||||
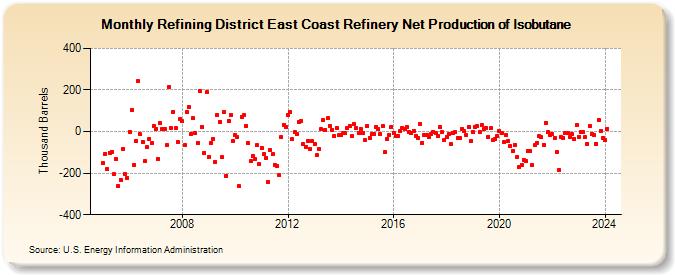
| Refining District East Coast Refinery Net Production of Isobutane (Thousand Barrels) | ||||||||
| Year | Jan | Feb | Mar | Apr | May | Jun | Jul | Aug | Sep | Oct | Nov | Dec |
|---|---|---|---|---|---|---|---|---|---|---|---|---|
| 2005 | -152 | -106 | -181 | -101 | -96 | -206 | -131 | -263 | -233 | -83 | -204 | -222 |
| 2006 | 0 | 105 | -160 | -45 | 241 | -13 | -48 | -144 | -75 | -35 | -57 | 27 |
| 2007 | 13 | -132 | 41 | 11 | 12 | -65 | 216 | 16 | 96 | 15 | -51 | 60 |
| 2008 | 49 | -66 | 93 | 118 | -12 | 63 | -9 | -53 | 195 | 24 | -101 | 189 |
| 2009 | -122 | -53 | -34 | -145 | 82 | 48 | -124 | 94 | -212 | 53 | 81 | -46 |
| 2010 | -16 | -28 | -264 | 70 | 78 | 28 | -57 | -143 | -117 | -132 | -67 | -155 |
| 2011 | -77 | -108 | -125 | -242 | -89 | -110 | -159 | -168 | -211 | -27 | 31 | 23 |
| 2012 | 80 | 93 | -38 | -4 | -11 | 46 | 51 | -62 | -73 | -46 | -85 | -47 |
| 2013 | -60 | -113 | -84 | 10 | 56 | 8 | 63 | 29 | 9 | -22 | 19 | -18 |
| 2014 | -17 | -8 | -9 | 19 | 28 | -21 | 37 | 18 | -5 | 14 | -7 | -43 |
| 2015 | 28 | -29 | -11 | -12 | 22 | 10 | -11 | 26 | -99 | -34 | -17 | 22 |
| 2016 | -8 | -23 | -21 | 3 | 18 | 13 | 23 | -3 | -7 | 3 | -20 | -31 |
| 2017 | 35 | -55 | -16 | -17 | -26 | -13 | -1 | -8 | -19 | 21 | -3 | -39 |
| 2018 | -26 | -11 | -61 | -7 | -3 | -32 | -29 | 14 | 5 | -18 | 21 | -46 |
| 2019 | -1 | 23 | 25 | -3 | 32 | 12 | 18 | -25 | 15 | -41 | -36 | -23 |
| 2020 | 2 | -6 | -50 | -18 | -44 | -69 | -92 | -63 | -121 | -170 | -161 | -135 |
| 2021 | -142 | -94 | -94 | -163 | -67 | -55 | -23 | -28 | -63 | 43 | -3 | -17 |
| 2022 | -12 | -31 | -99 | -183 | -25 | -29 | -8 | -5 | -27 | -12 | -34 | 31 |
| 2023 | -26 | -1 | -2 | -28 | -59 | 27 | -14 | -16 | -58 | 56 | 4 | -31 |
| 2024 | -43 | 14 | ||||||||||
| - = No Data Reported; -- = Not Applicable; NA = Not Available; W = Withheld to avoid disclosure of individual company data. |
| Release Date: 4/30/2024 |
| Next Release Date: 5/31/2024 |
Referring Pages: