|
Download Data (XLS File) |
|
||||||||
|
||||||||
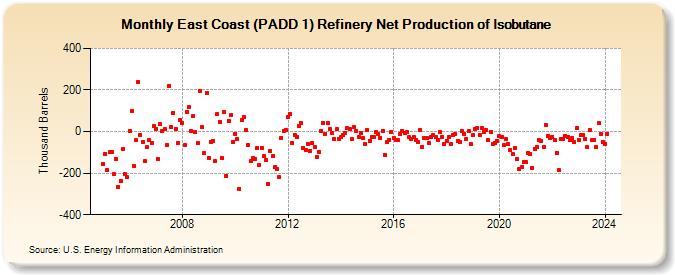
| East Coast (PADD 1) Refinery Net Production of Isobutane (Thousand Barrels) | ||||||||
| Year | Jan | Feb | Mar | Apr | May | Jun | Jul | Aug | Sep | Oct | Nov | Dec |
|---|---|---|---|---|---|---|---|---|---|---|---|---|
| 2005 | -158 | -106 | -185 | -100 | -100 | -205 | -131 | -265 | -236 | -85 | -205 | -220 |
| 2006 | 3 | 100 | -165 | -43 | 240 | -17 | -49 | -144 | -75 | -39 | -57 | 26 |
| 2007 | 14 | -131 | 36 | 3 | 12 | -63 | 220 | 21 | 90 | 14 | -56 | 56 |
| 2008 | 43 | -65 | 96 | 118 | 4 | 75 | -2 | -53 | 196 | 22 | -104 | 187 |
| 2009 | -125 | -52 | -44 | -144 | 83 | 46 | -126 | 92 | -212 | 52 | 80 | -50 |
| 2010 | -11 | -34 | -275 | 56 | 70 | 7 | -65 | -144 | -125 | -132 | -81 | -162 |
| 2011 | -81 | -119 | -135 | -251 | -94 | -119 | -171 | -182 | -221 | -31 | 4 | 7 |
| 2012 | 70 | 84 | -54 | -15 | -26 | 28 | 40 | -79 | -89 | -58 | -92 | -57 |
| 2013 | -76 | -121 | -97 | 5 | 43 | -11 | 42 | 13 | -7 | -35 | 11 | -34 |
| 2014 | -27 | -17 | -8 | 17 | 12 | -36 | 20 | 2 | -26 | -5 | -32 | -61 |
| 2015 | 8 | -46 | -26 | -25 | -3 | -12 | -29 | 4 | -113 | -52 | -39 | 0 |
| 2016 | -29 | -43 | -42 | -11 | 5 | -8 | -3 | -28 | -35 | -26 | -40 | -52 |
| 2017 | 7 | -72 | -33 | -32 | -55 | -28 | -17 | -28 | -39 | -2 | -24 | -59 |
| 2018 | -44 | -25 | -61 | -15 | -11 | -44 | -48 | 2 | -10 | -34 | 2 | -60 |
| 2019 | -16 | 13 | 15 | -15 | 18 | -1 | 8 | -43 | -3 | -59 | -55 | -45 |
| 2020 | -22 | -25 | -65 | -37 | -60 | -88 | -109 | -77 | -134 | -181 | -172 | -146 |
| 2021 | -148 | -103 | -106 | -174 | -82 | -75 | -41 | -47 | -75 | 31 | -19 | -29 |
| 2022 | -26 | -41 | -101 | -187 | -34 | -38 | -20 | -24 | -41 | -29 | -50 | 16 |
| 2023 | -43 | -18 | -16 | -37 | -76 | 7 | -43 | -41 | -75 | 42 | -11 | -50 |
| 2024 | -58 | |||||||||||
| - = No Data Reported; -- = Not Applicable; NA = Not Available; W = Withheld to avoid disclosure of individual company data. |
| Release Date: 3/29/2024 |
| Next Release Date: 4/30/2024 |
Referring Pages: